Earnings Intelligence Suite
Master Every Earnings Event
The Earnings Intelligence Suite gives you everything you need to trade earnings with confidence. From comprehensive calendars and historical pattern analysis to AI-powered transcript insights— understand the full picture before, during, and after every earnings announcement.
Access Earnings Suite in NexsenComplete Earnings Analysis
Six powerful tools to analyze, understand, and profit from earnings events.
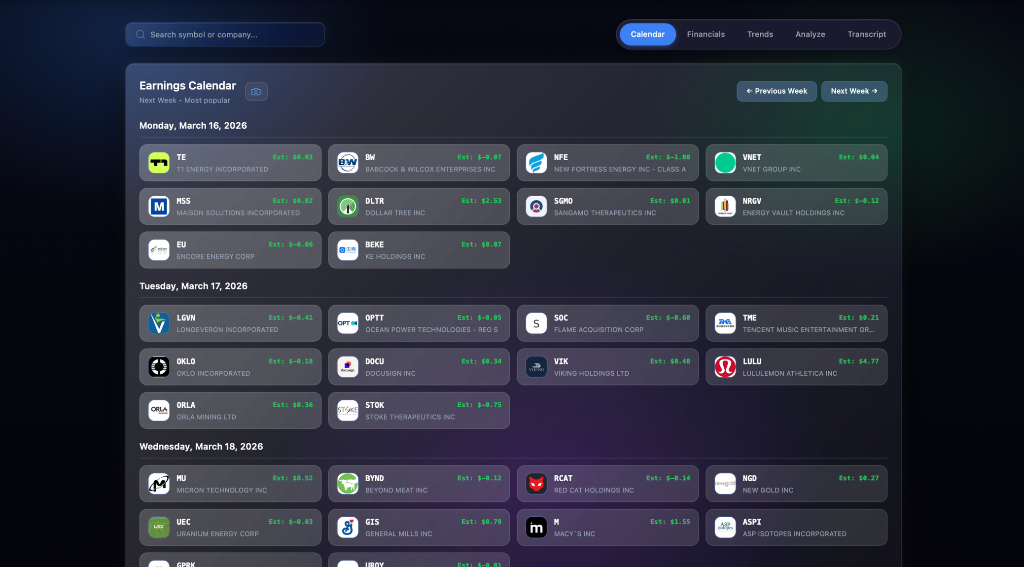
Earnings Calendar
Stay ahead of the market with our comprehensive earnings calendar. View upcoming reports across hundreds of companies organized by date, complete with company logos for instant recognition. Filter by week, navigate between time periods, and never miss a critical earnings announcement. Know exactly when your positions face earnings risk and plan your trades accordingly.
Earnings Surprise Heatmap & Revenue Metrics
Decode historical earnings patterns with our visual surprise heatmap. See at a glance which quarters consistently beat or miss expectations, with color-coded cells showing the magnitude of each surprise. Dive deeper with quarterly revenue and income trends, plus beat rate statistics across Q1-Q4. Identify companies with reliable earnings patterns and spot potential opportunities before the next report.
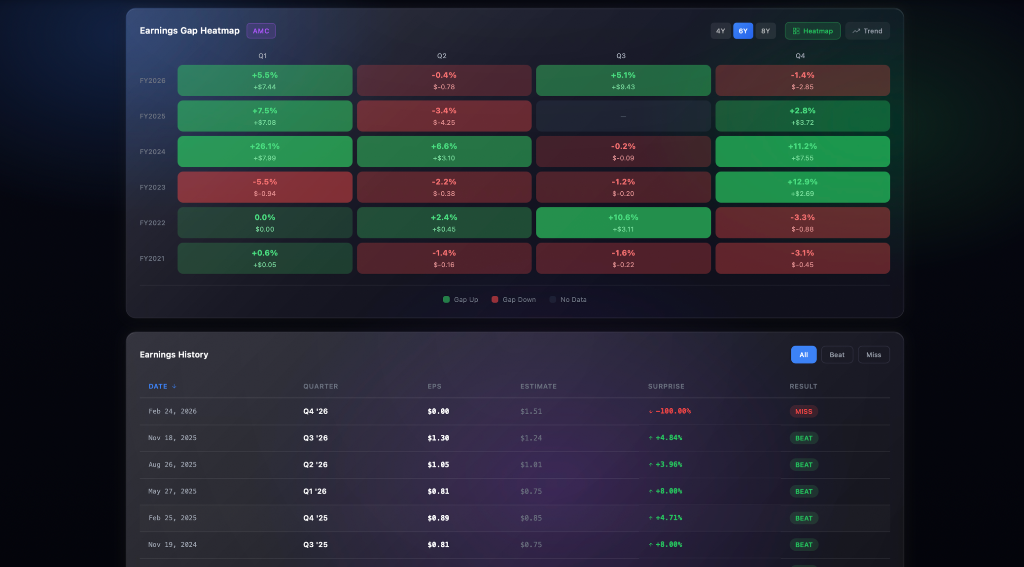
Earnings Gap Heatmap & Earnings History
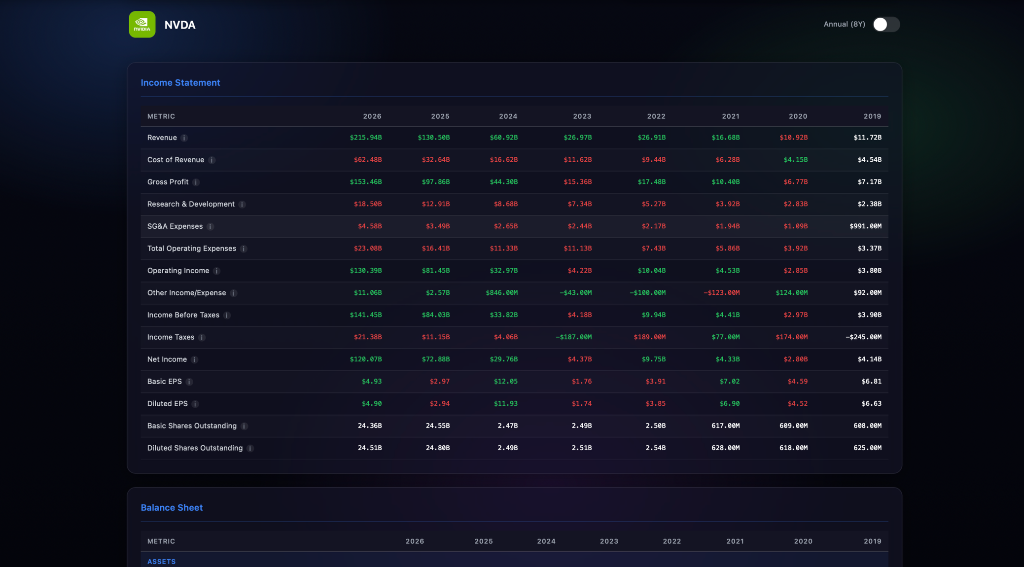
Financial Statements — Up to 8 Years of History
Dig into the numbers that drive earnings with full financial statement history spanning up to 8 years. Access income statements, balance sheets, and cash flow data across multiple fiscal years so you can track long-term trends in revenue growth, margin expansion, debt levels, and free cash flow. Understanding a company's financial trajectory—not just the latest quarter—gives you a decisive edge when evaluating earnings setups.
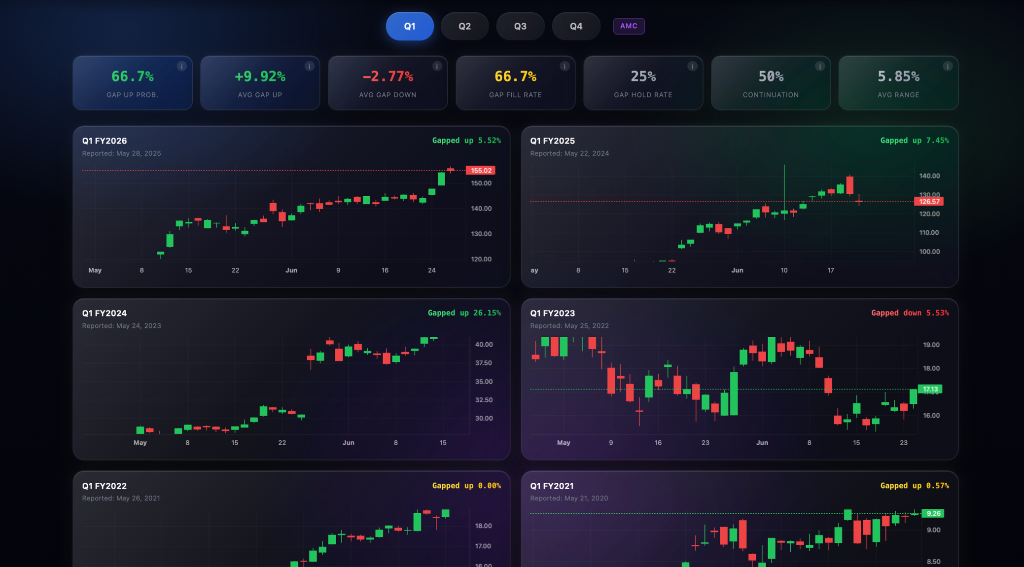
Price Action Charting
Visualize up to 8 years of earnings reactions with our integrated candlestick charts. Filter by specific quarter—Q1, Q2, Q3, or Q4—to isolate how a stock has historically reacted to that exact reporting period. See the full price move from open to close on earnings day, identify recurring seasonal patterns, and measure the typical magnitude of post-earnings volatility. Whether a company consistently gaps up on Q4 beats or fades after Q2 misses, this tool surfaces those patterns instantly—giving you data-backed context for sizing positions and setting realistic profit targets.
Earnings Call Transcripts & Key Metrics
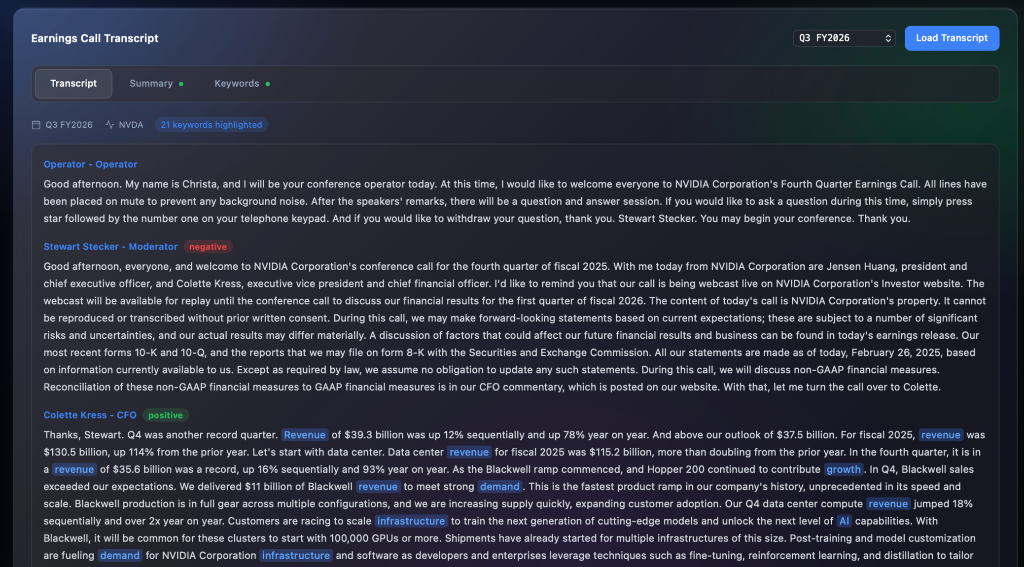
Access full earnings call transcripts with powerful search and navigation. See key financial highlights at a glance—total revenue, profitability margins, EBITDA, operating income, and EPS growth—all pulled directly from the latest reports. No more digging through SEC filings or waiting for analyst summaries. Get the raw data and exact words from management, instantly.
AI Transcript Analysis
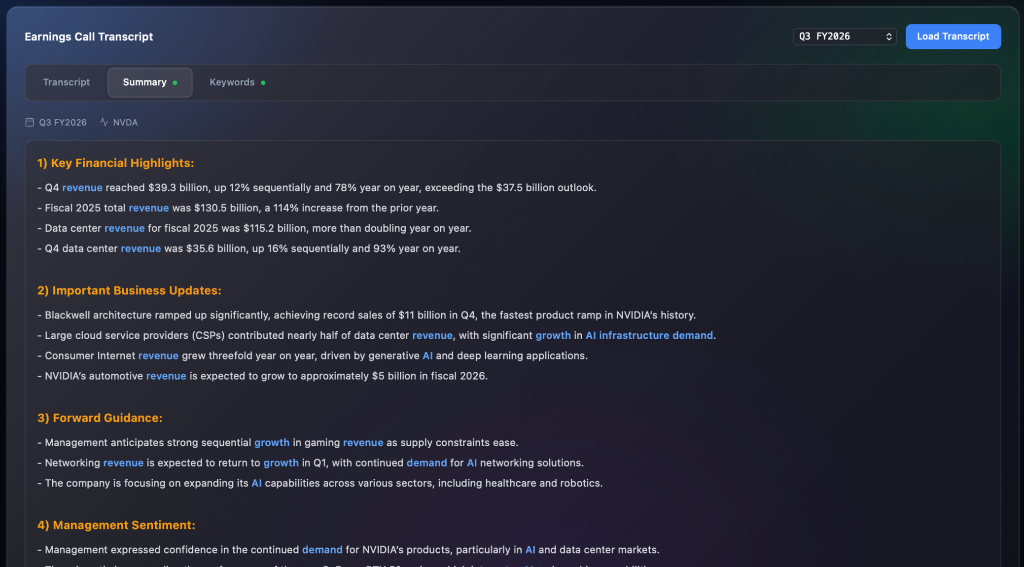
Let Trading Bulls A.I do the heavy lifting. Our AI analyzes earnings call transcripts to extract key financial highlights, important business updates, forward guidance, and management sentiment. Surface top keywords and themes mentioned throughout the call, identify growth trajectories, operational efficiency insights, and potential risks—all summarized in seconds instead of hours of manual review.
Ready to Master
Earnings Season?
Stop trading earnings blind. Get the data, patterns, and AI-powered insights you need to make informed decisions every earnings season.
Start Using Earnings Suite