
Nexsen Terminal.
Your research,
connected.
A complete environment for investigating the market. Bring price, positioning, company intelligence and your next question into one working view.
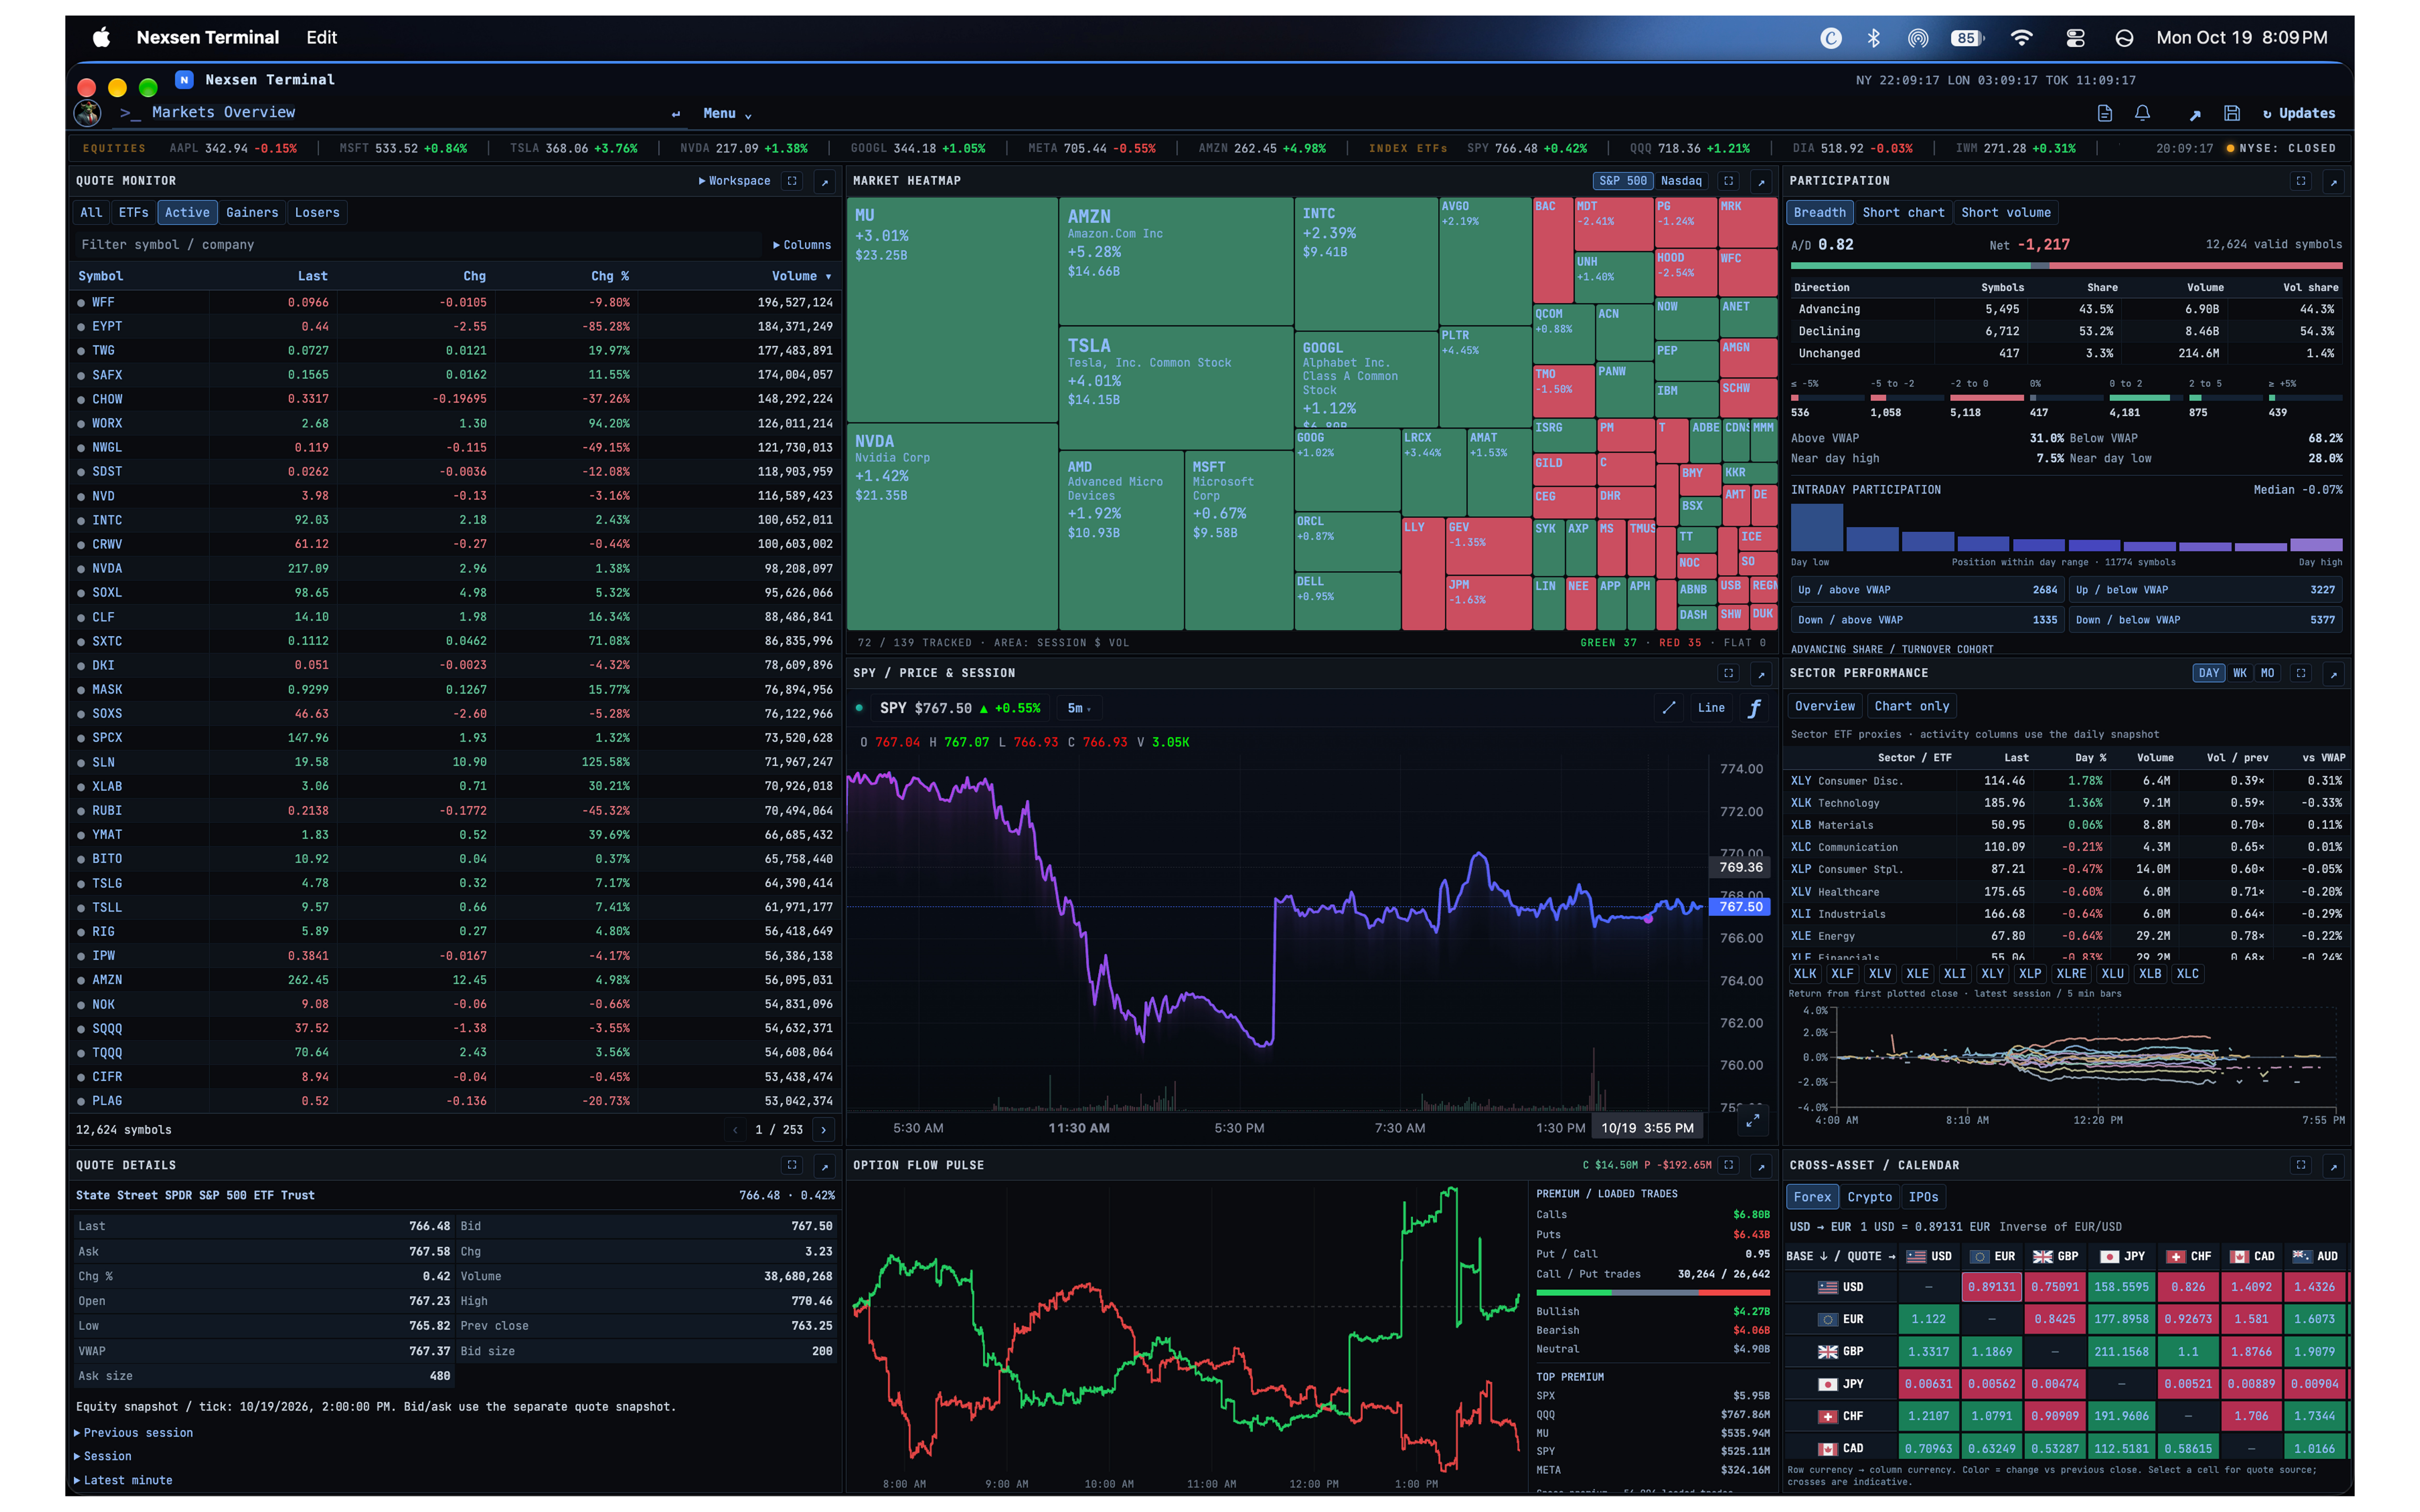
Start wide. Find your focus.
Read market breadth, sector performance and the names on your watchlist before narrowing your research to a single opportunity.
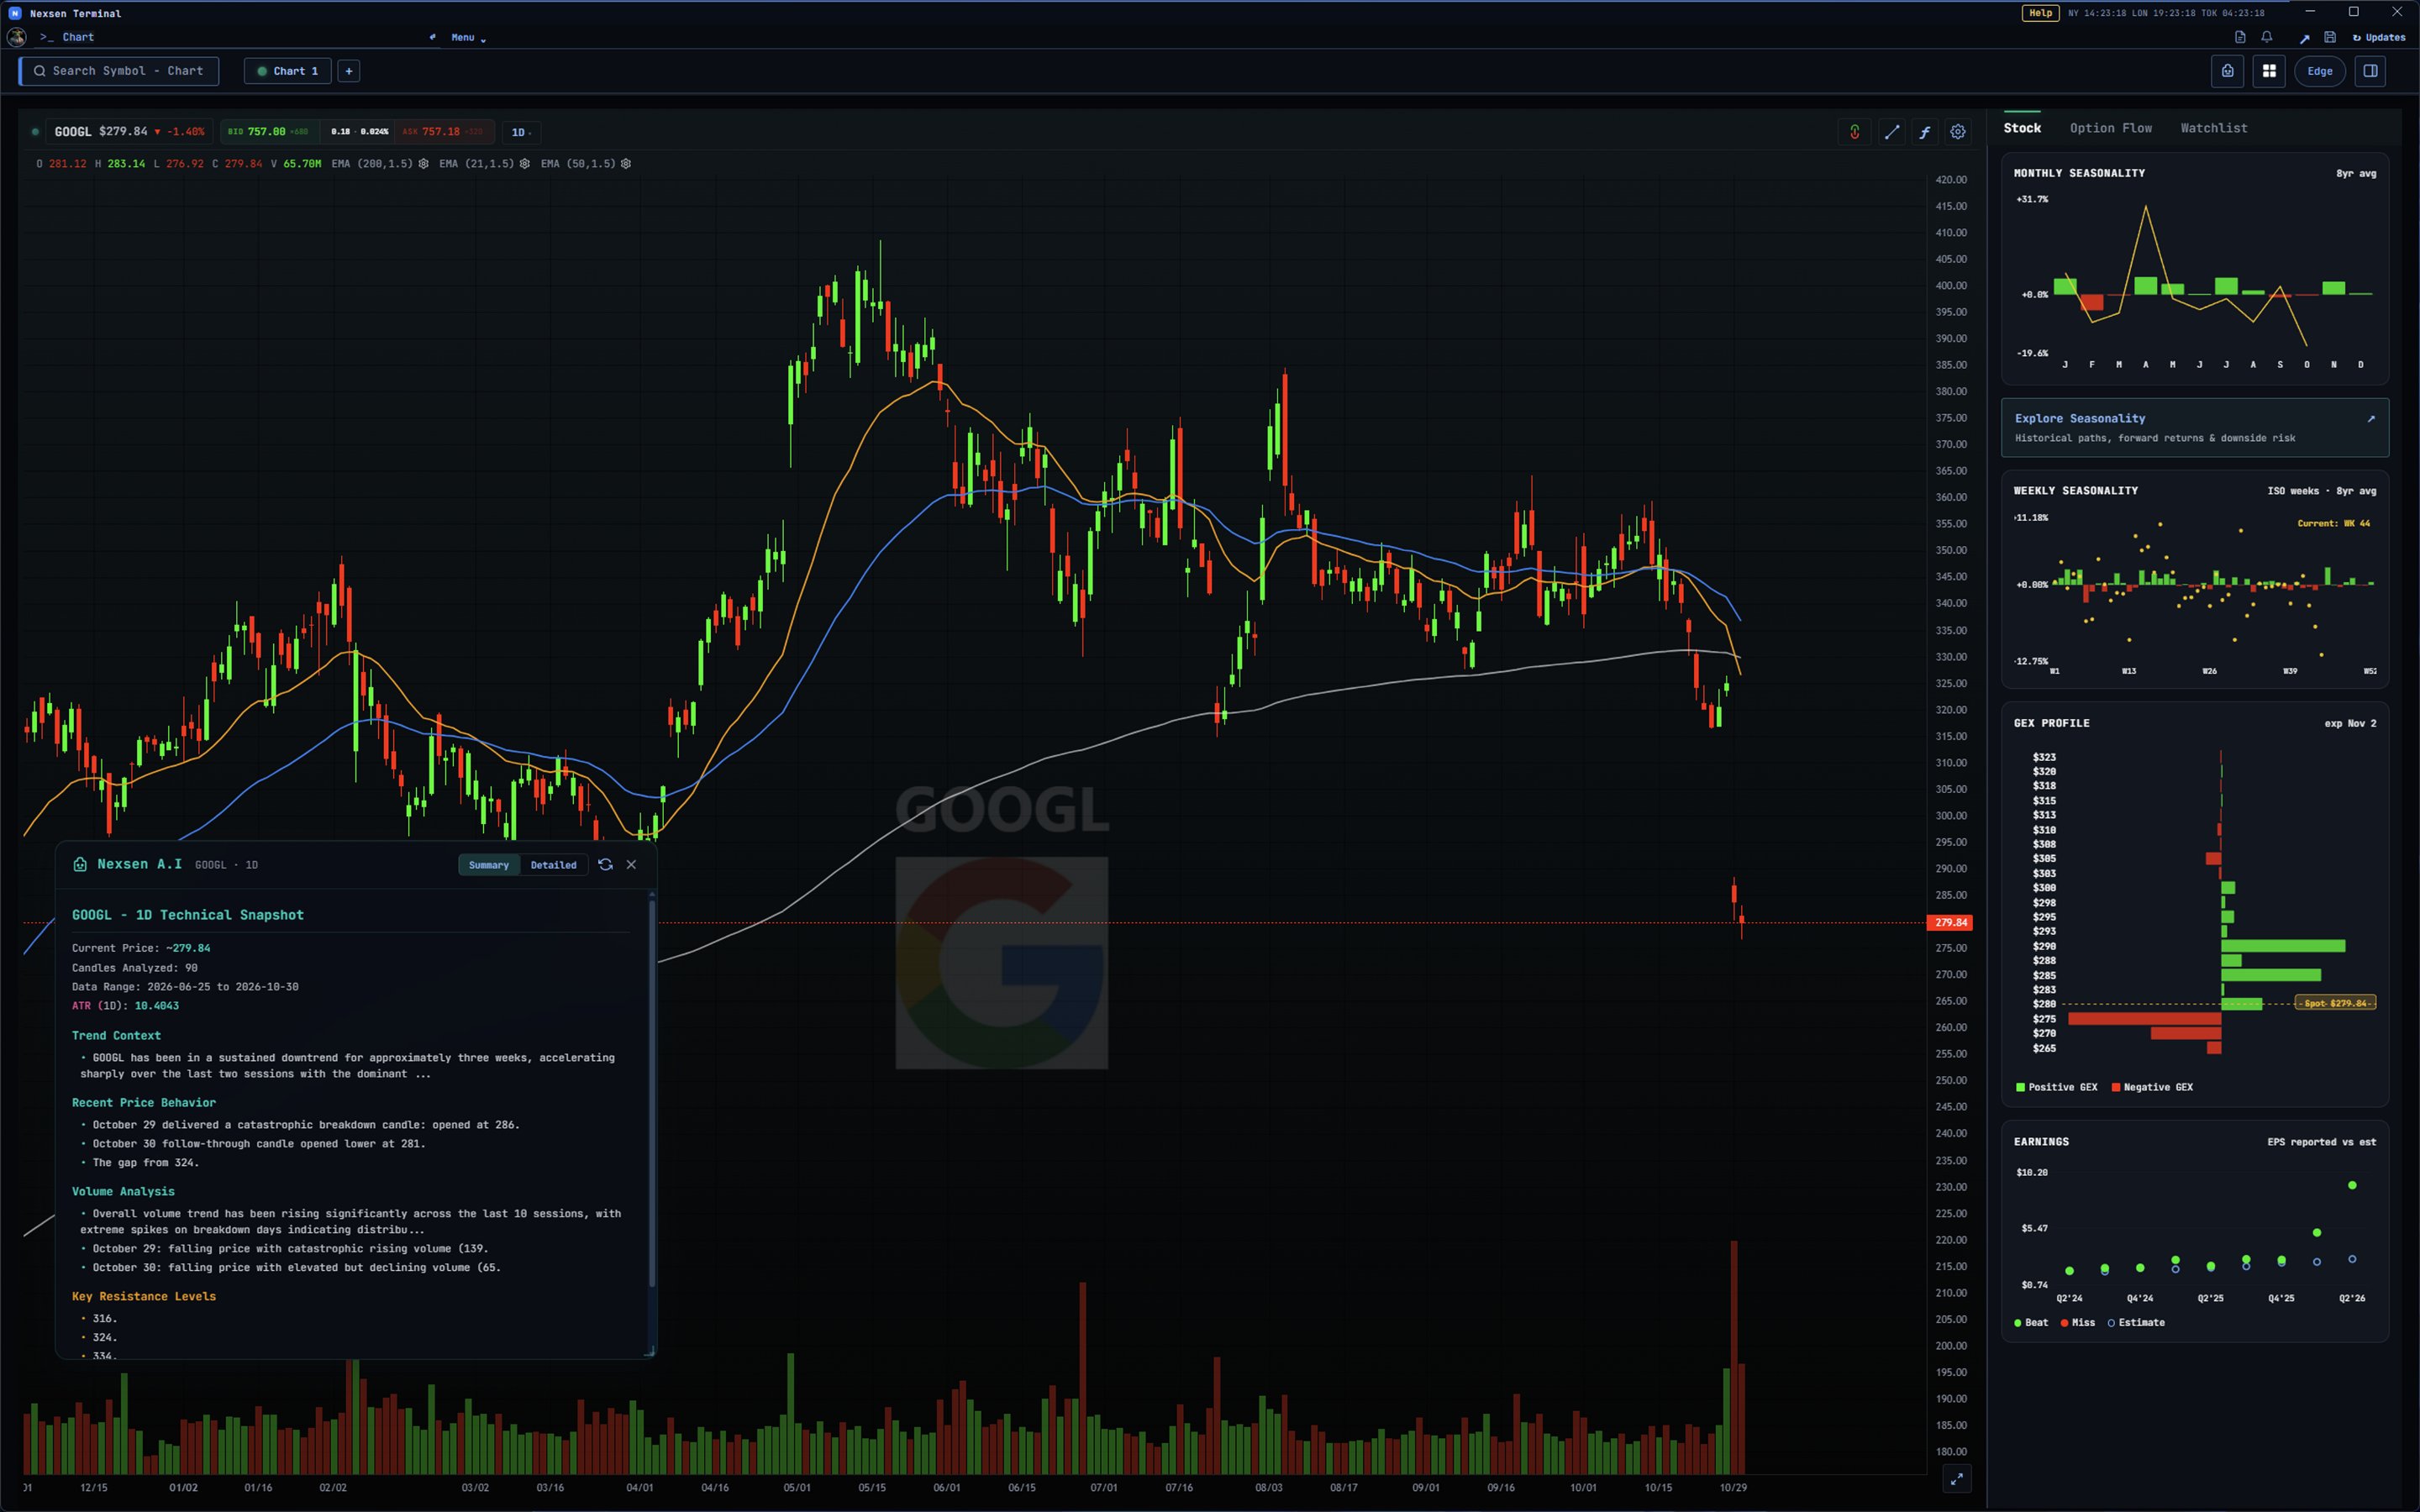
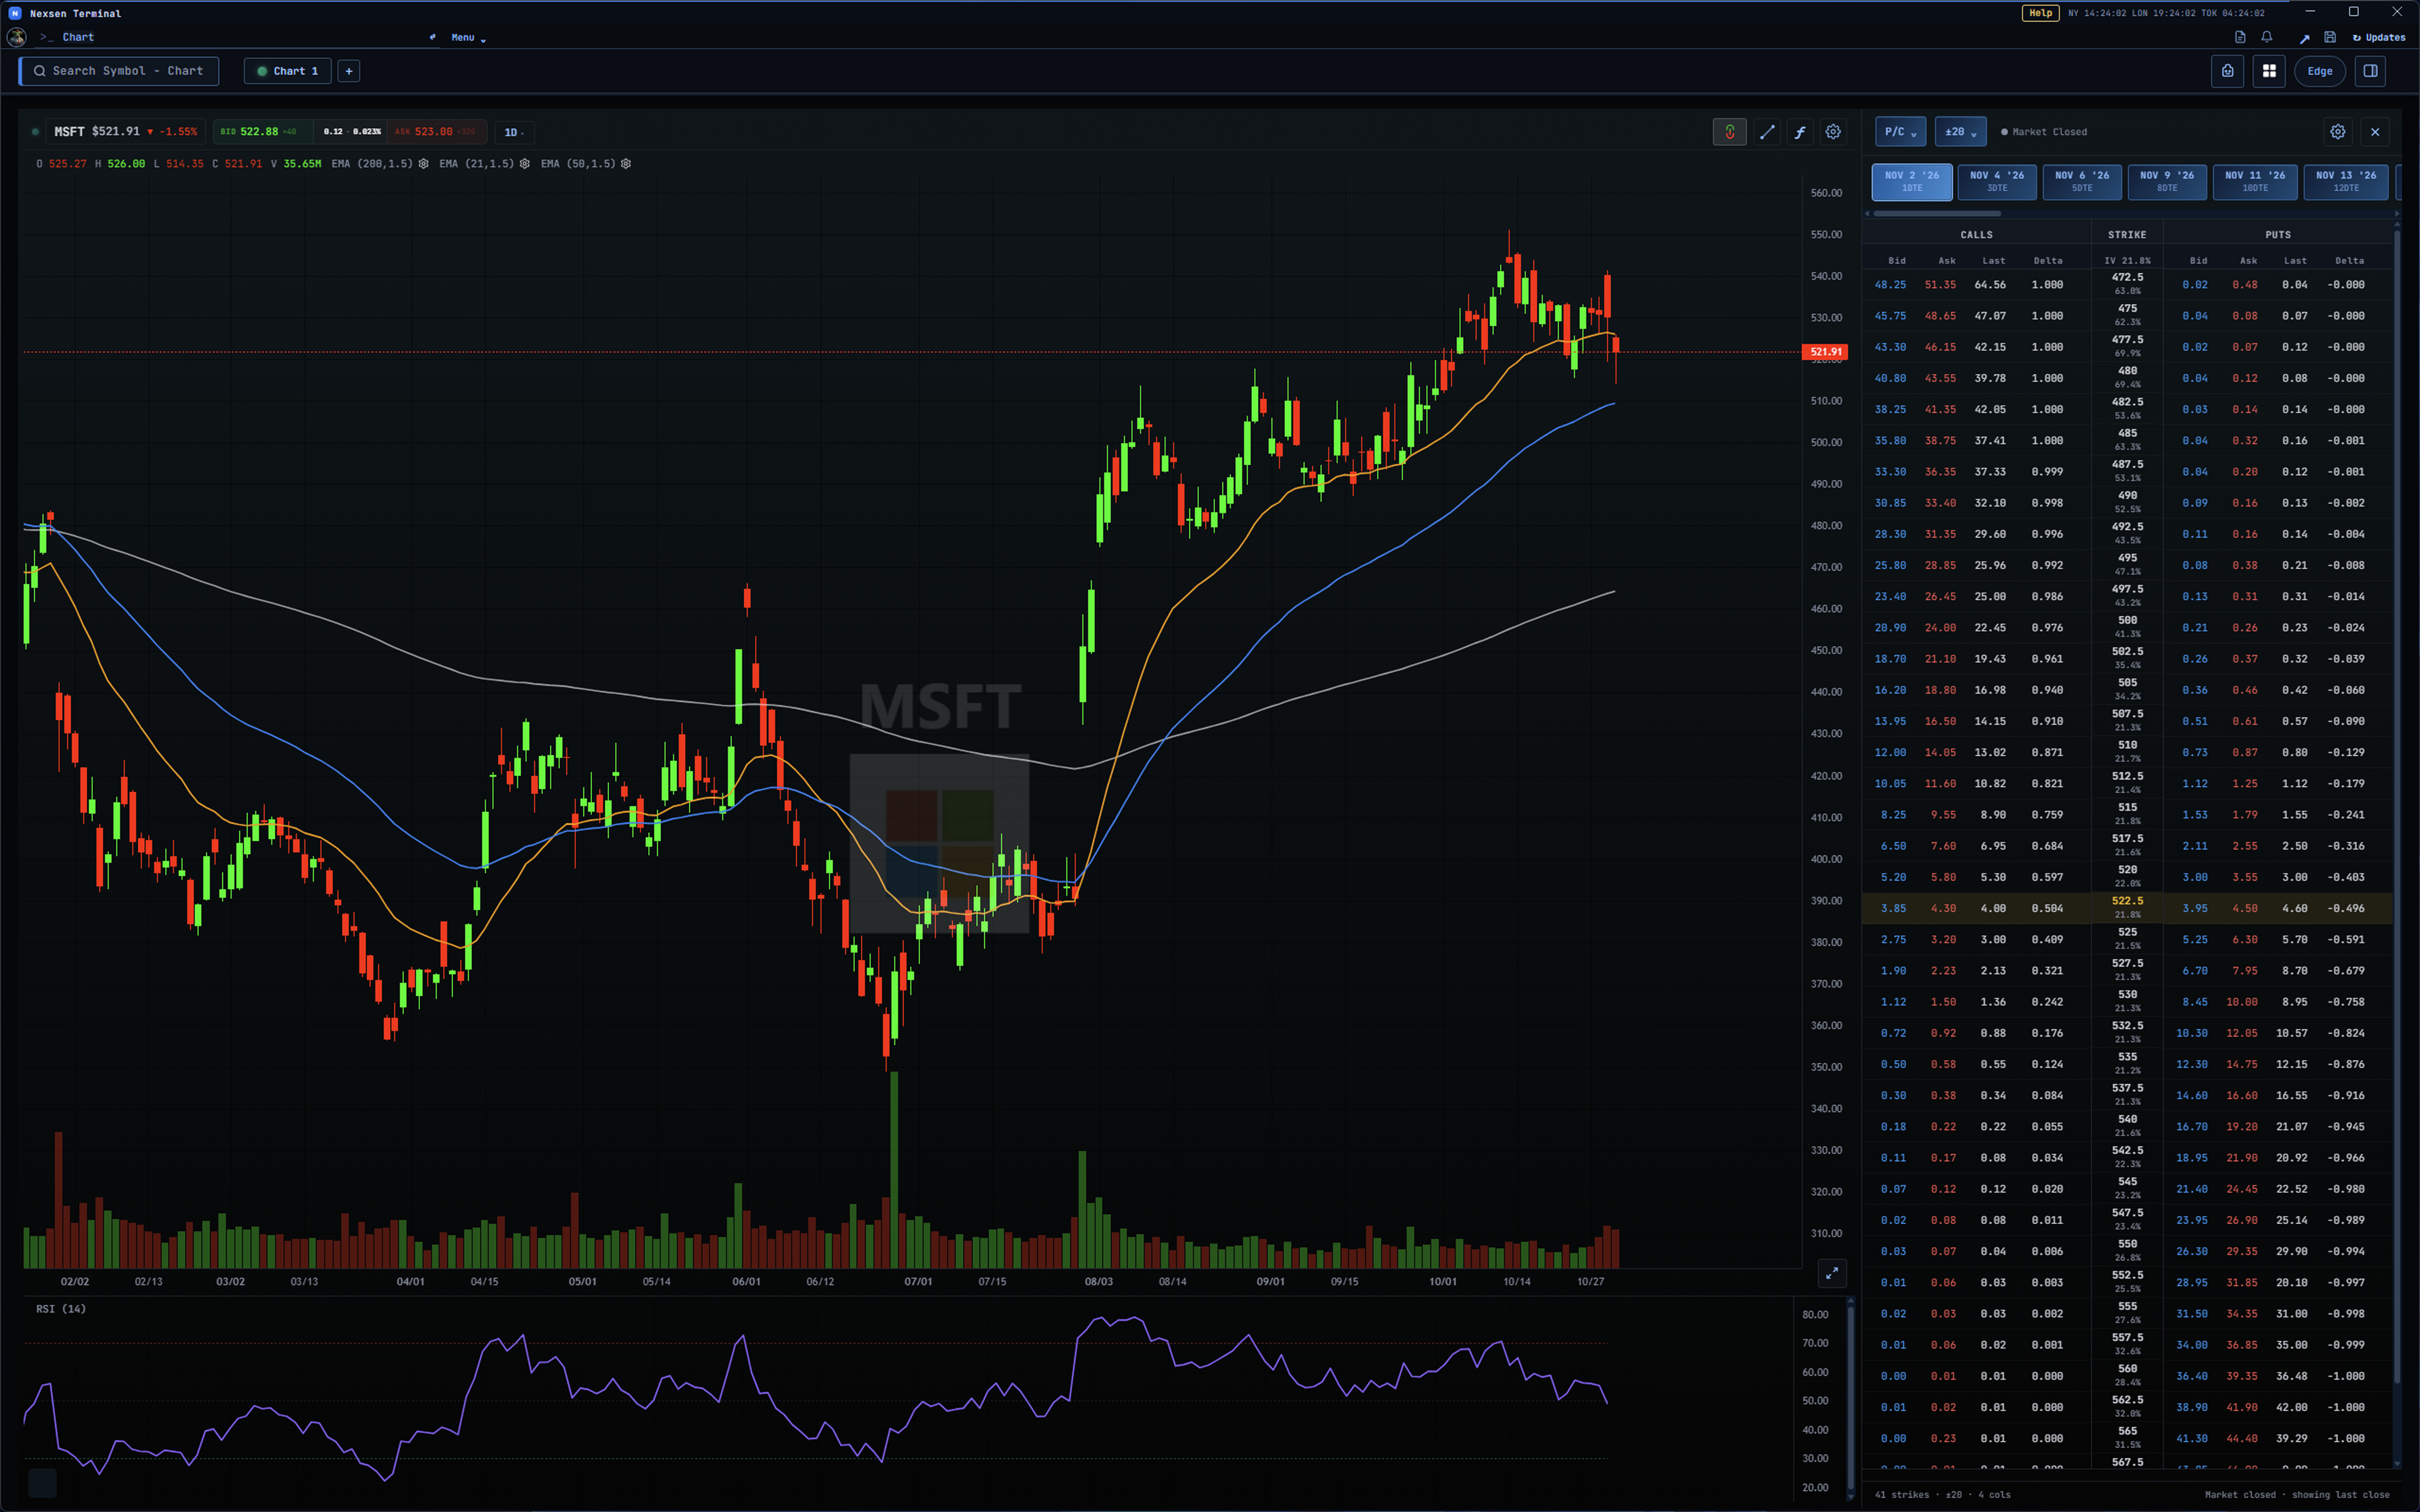
Give every idea a place on the chart.
Explore price structure across timeframes. Arrange charts, drawing tools and studies alongside the information you use to evaluate a setup.
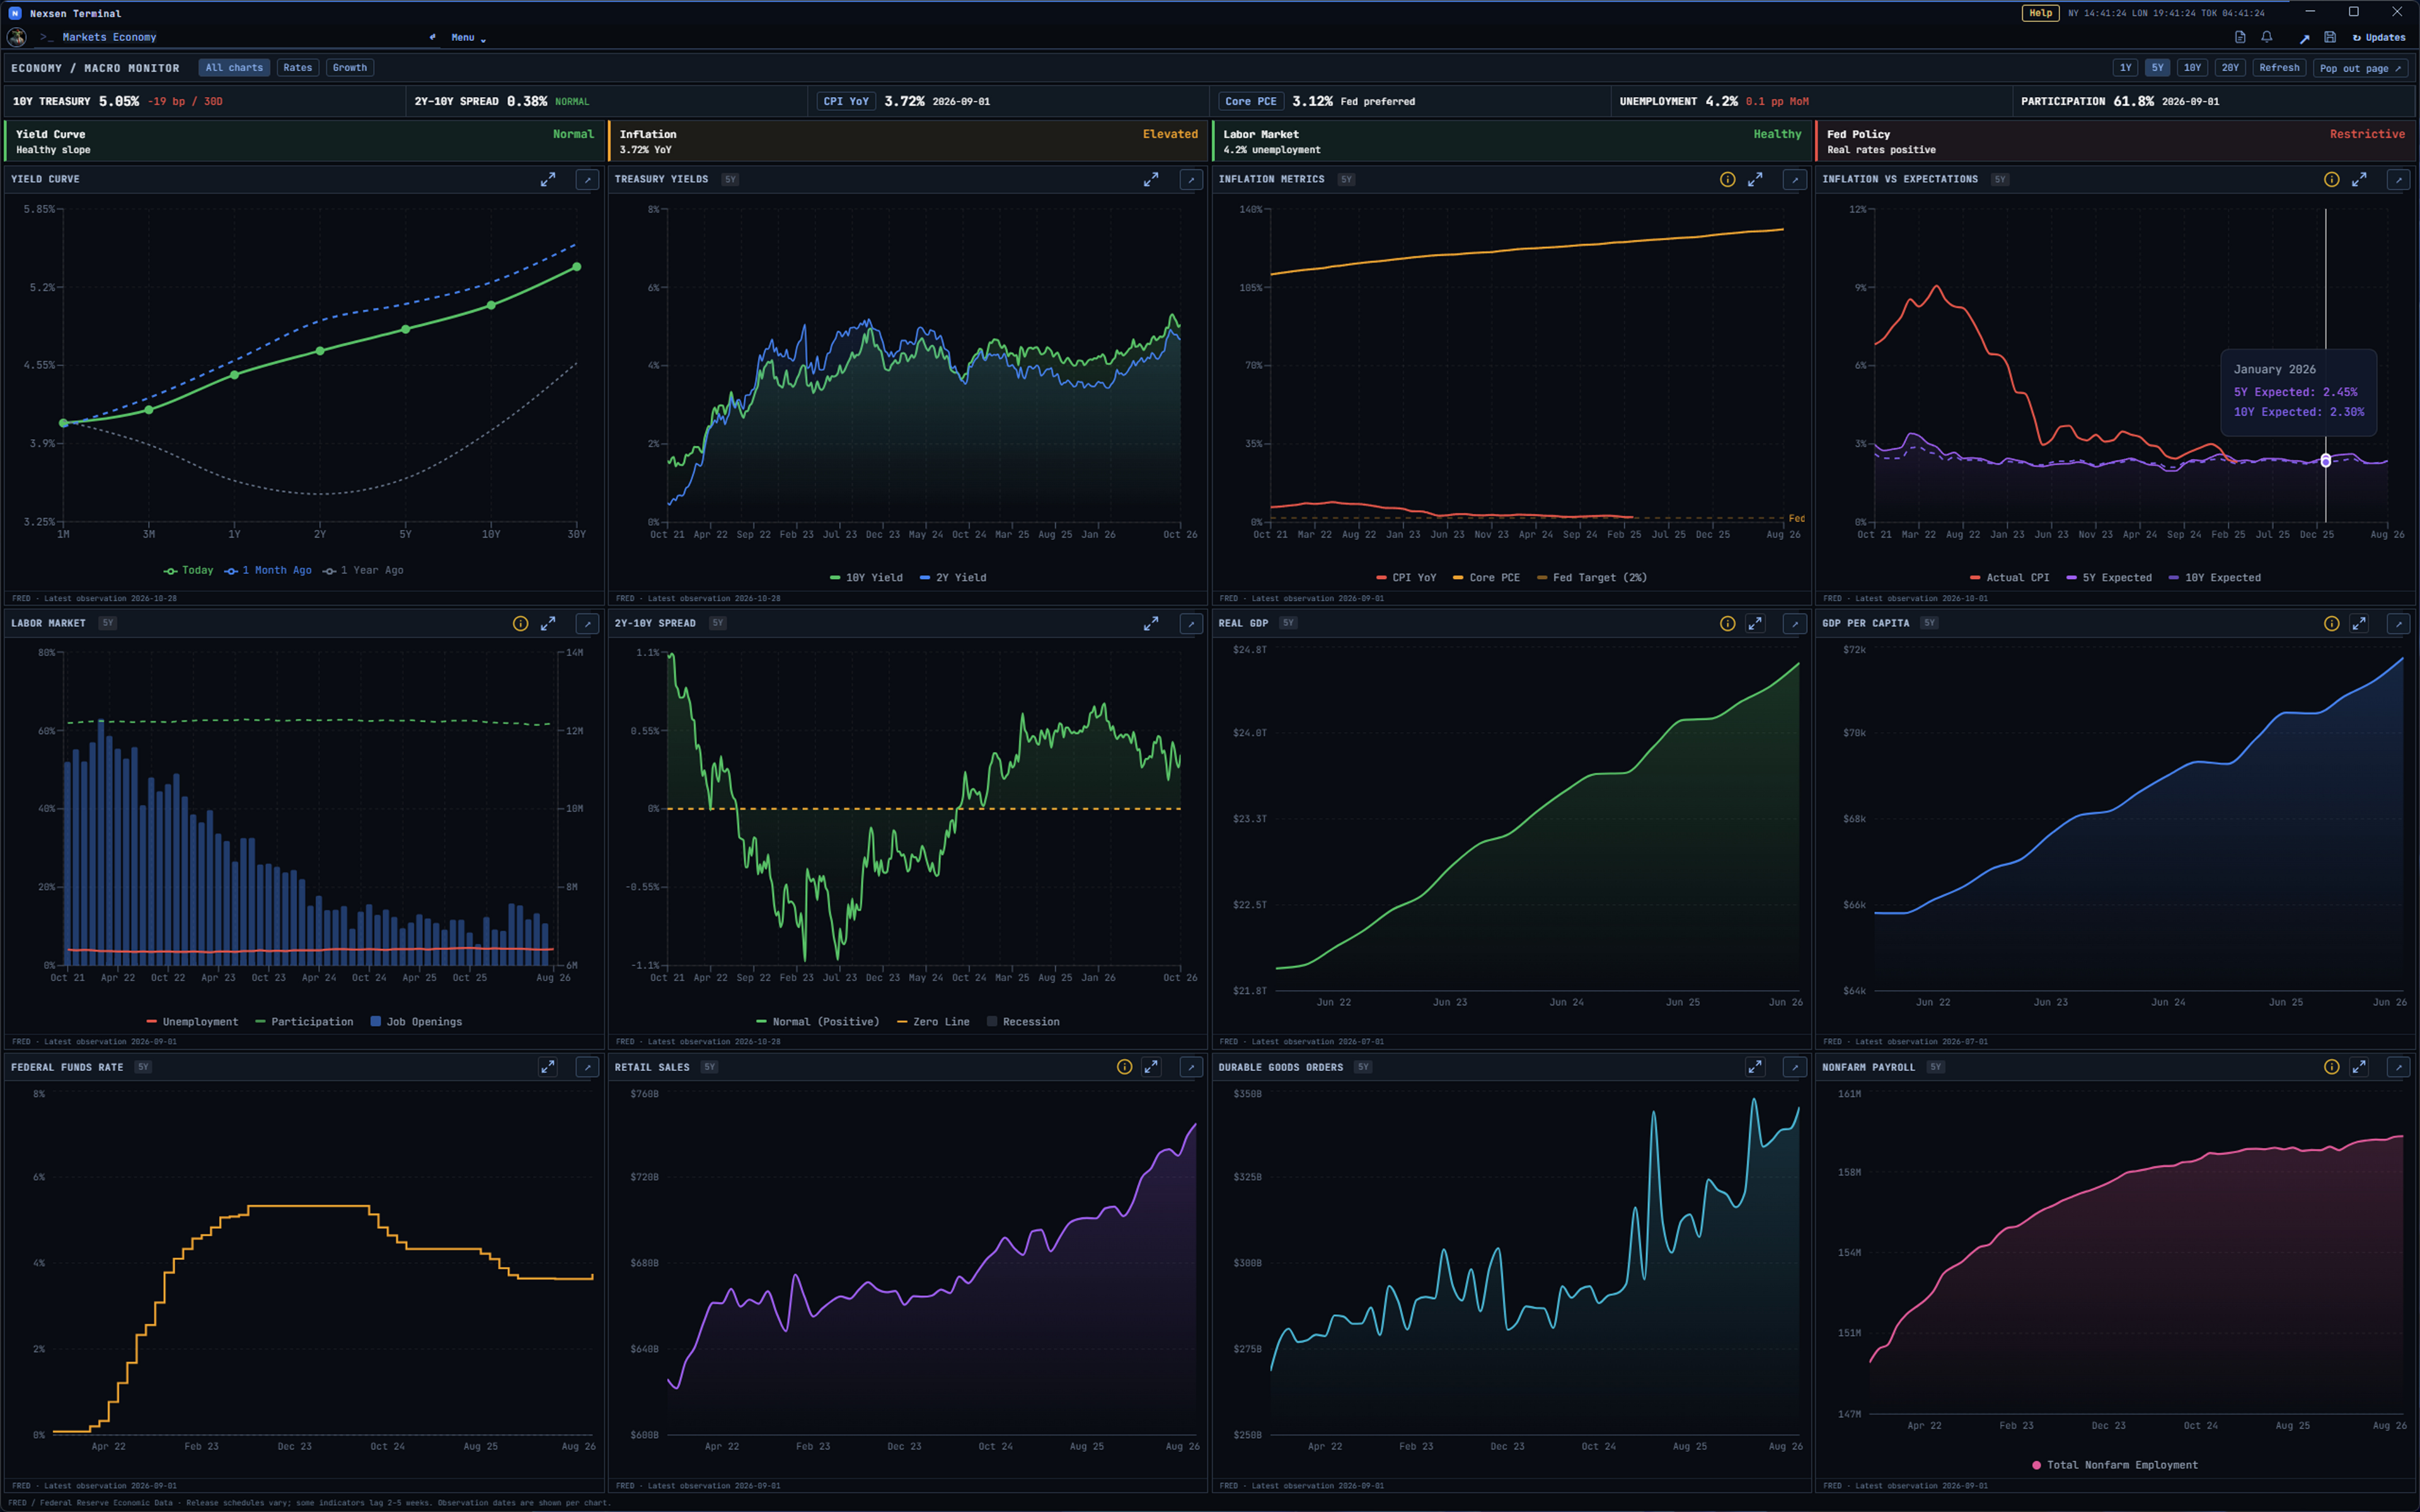
Keep the bigger forces in view.
Follow rates, inflation, employment and other economic indicators together to put individual market moves in context.
 Back to platform index
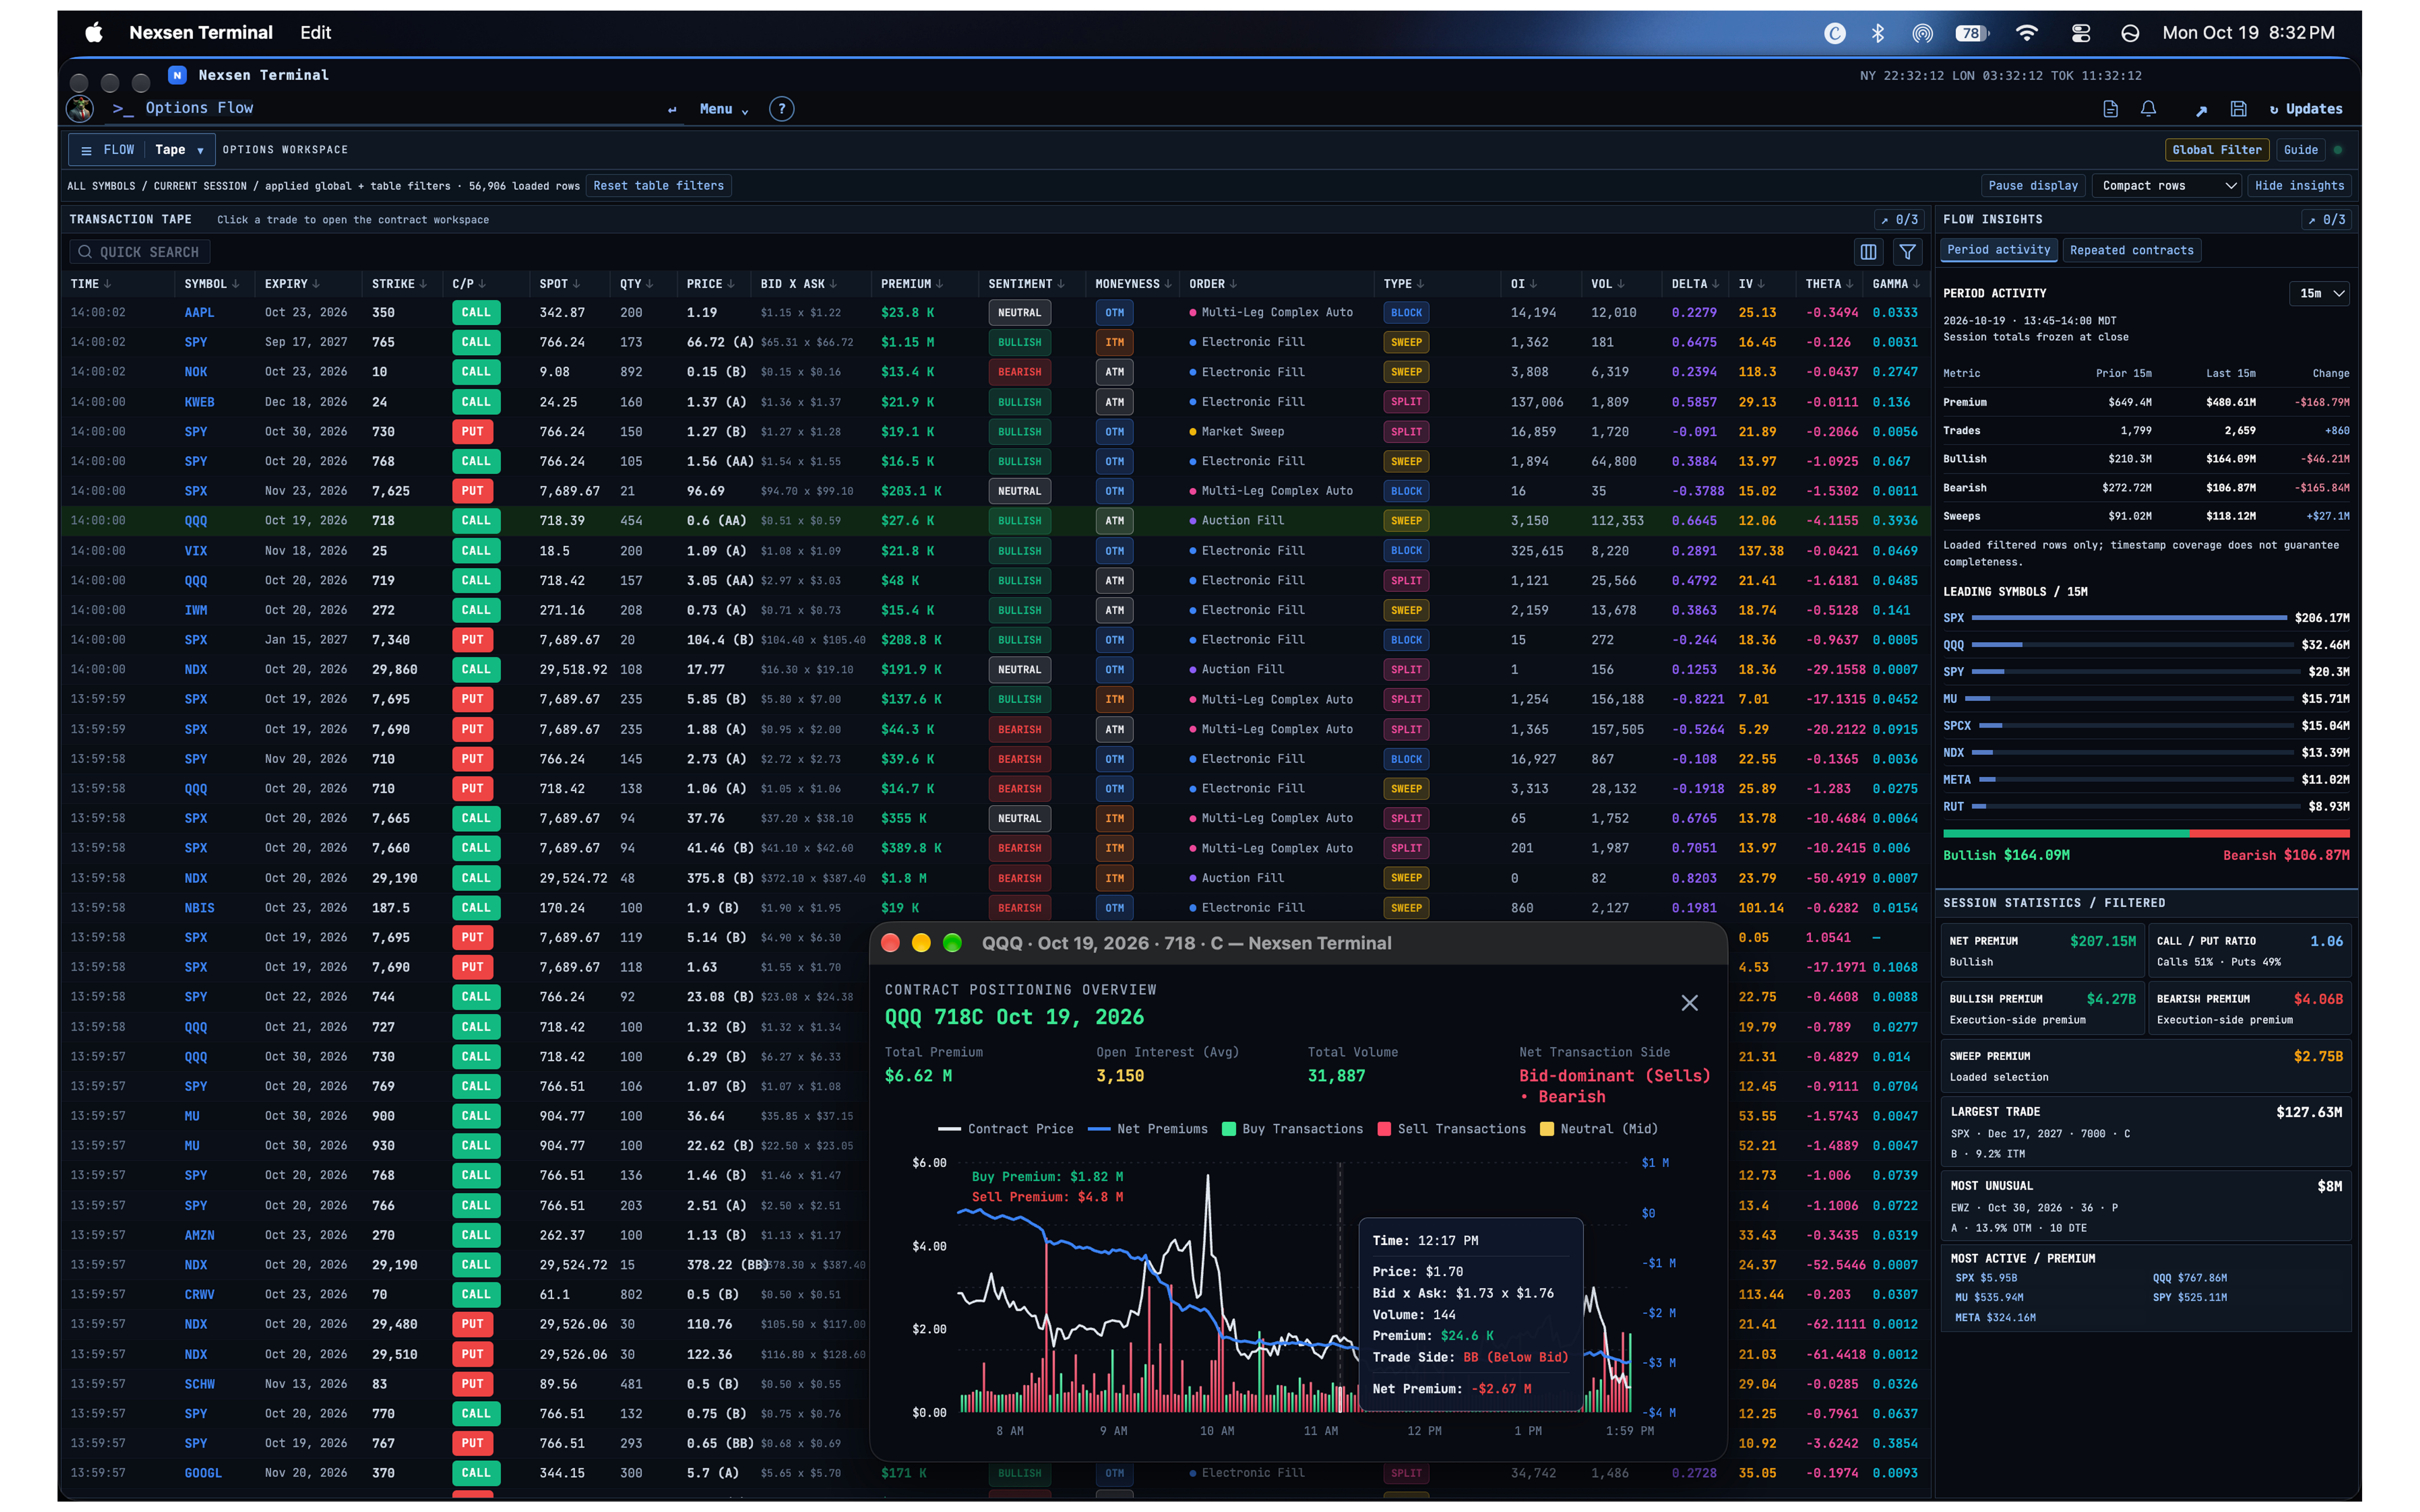
Read the activity behind the move.
Inspect individual options transactions, filter the tape and investigate the size, direction and timing of activity in the names you follow.
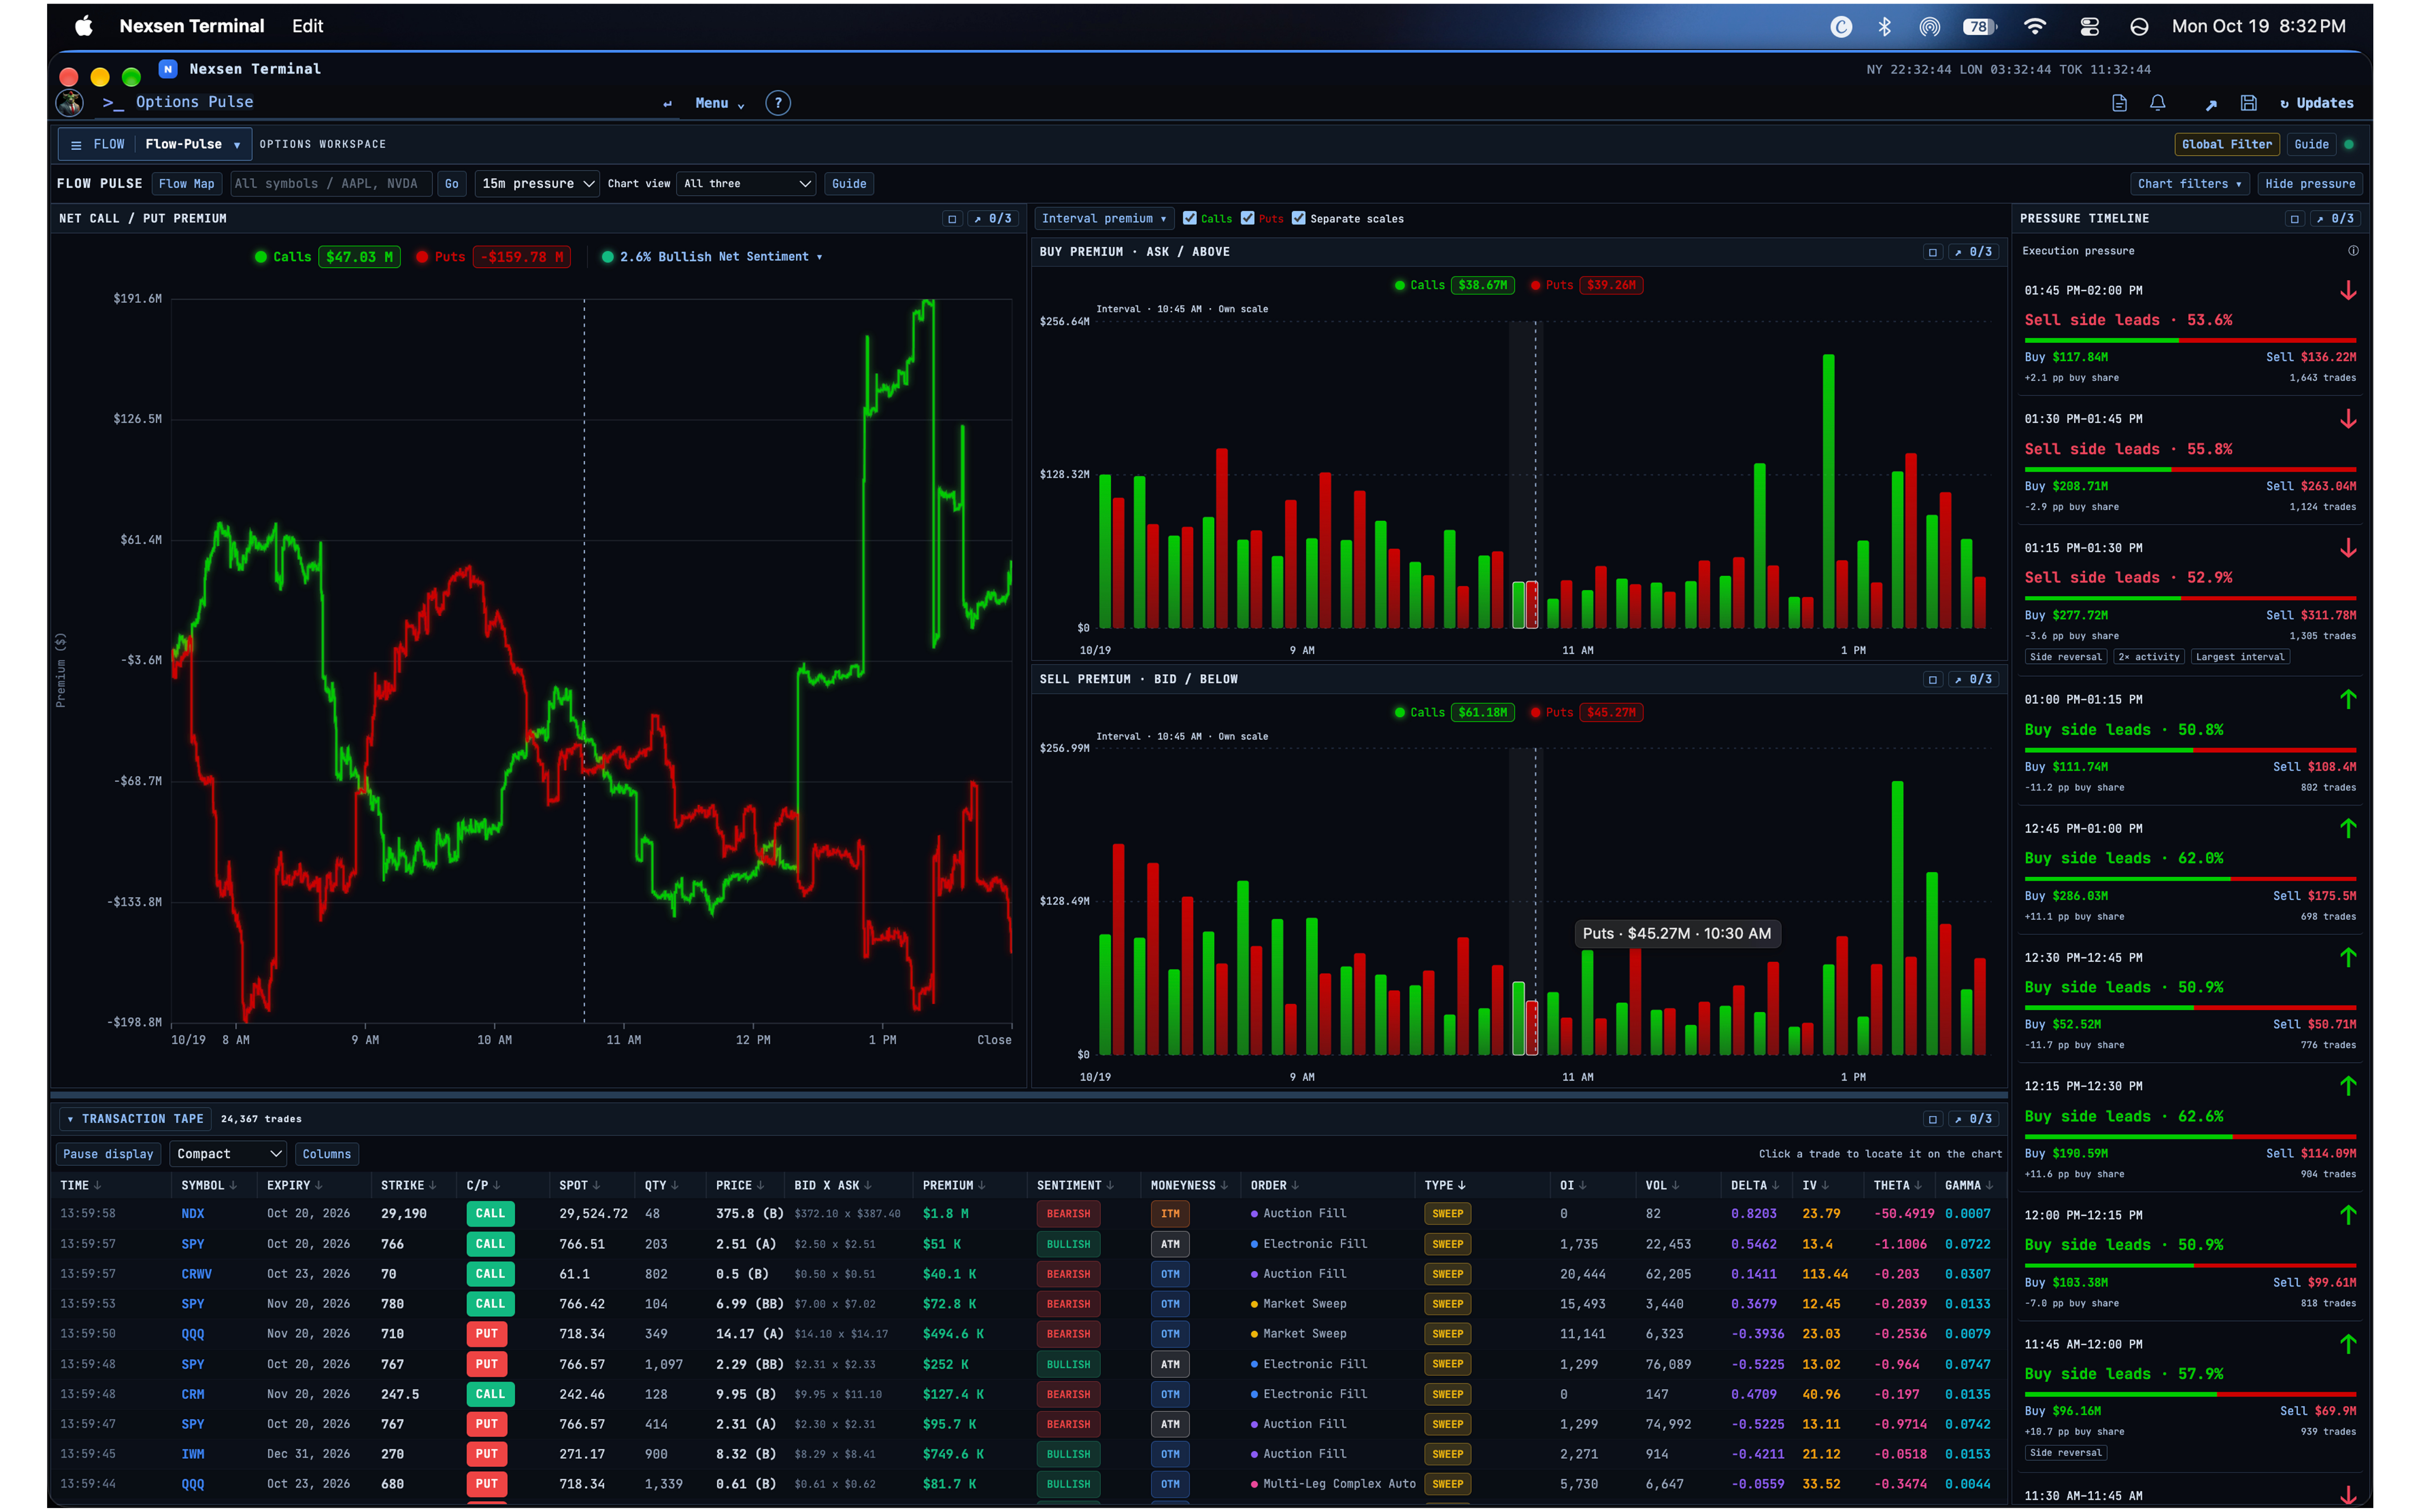
Follow pressure through the session.
Compare cumulative options activity with the underlying price to see where buying and selling pressure builds or changes.
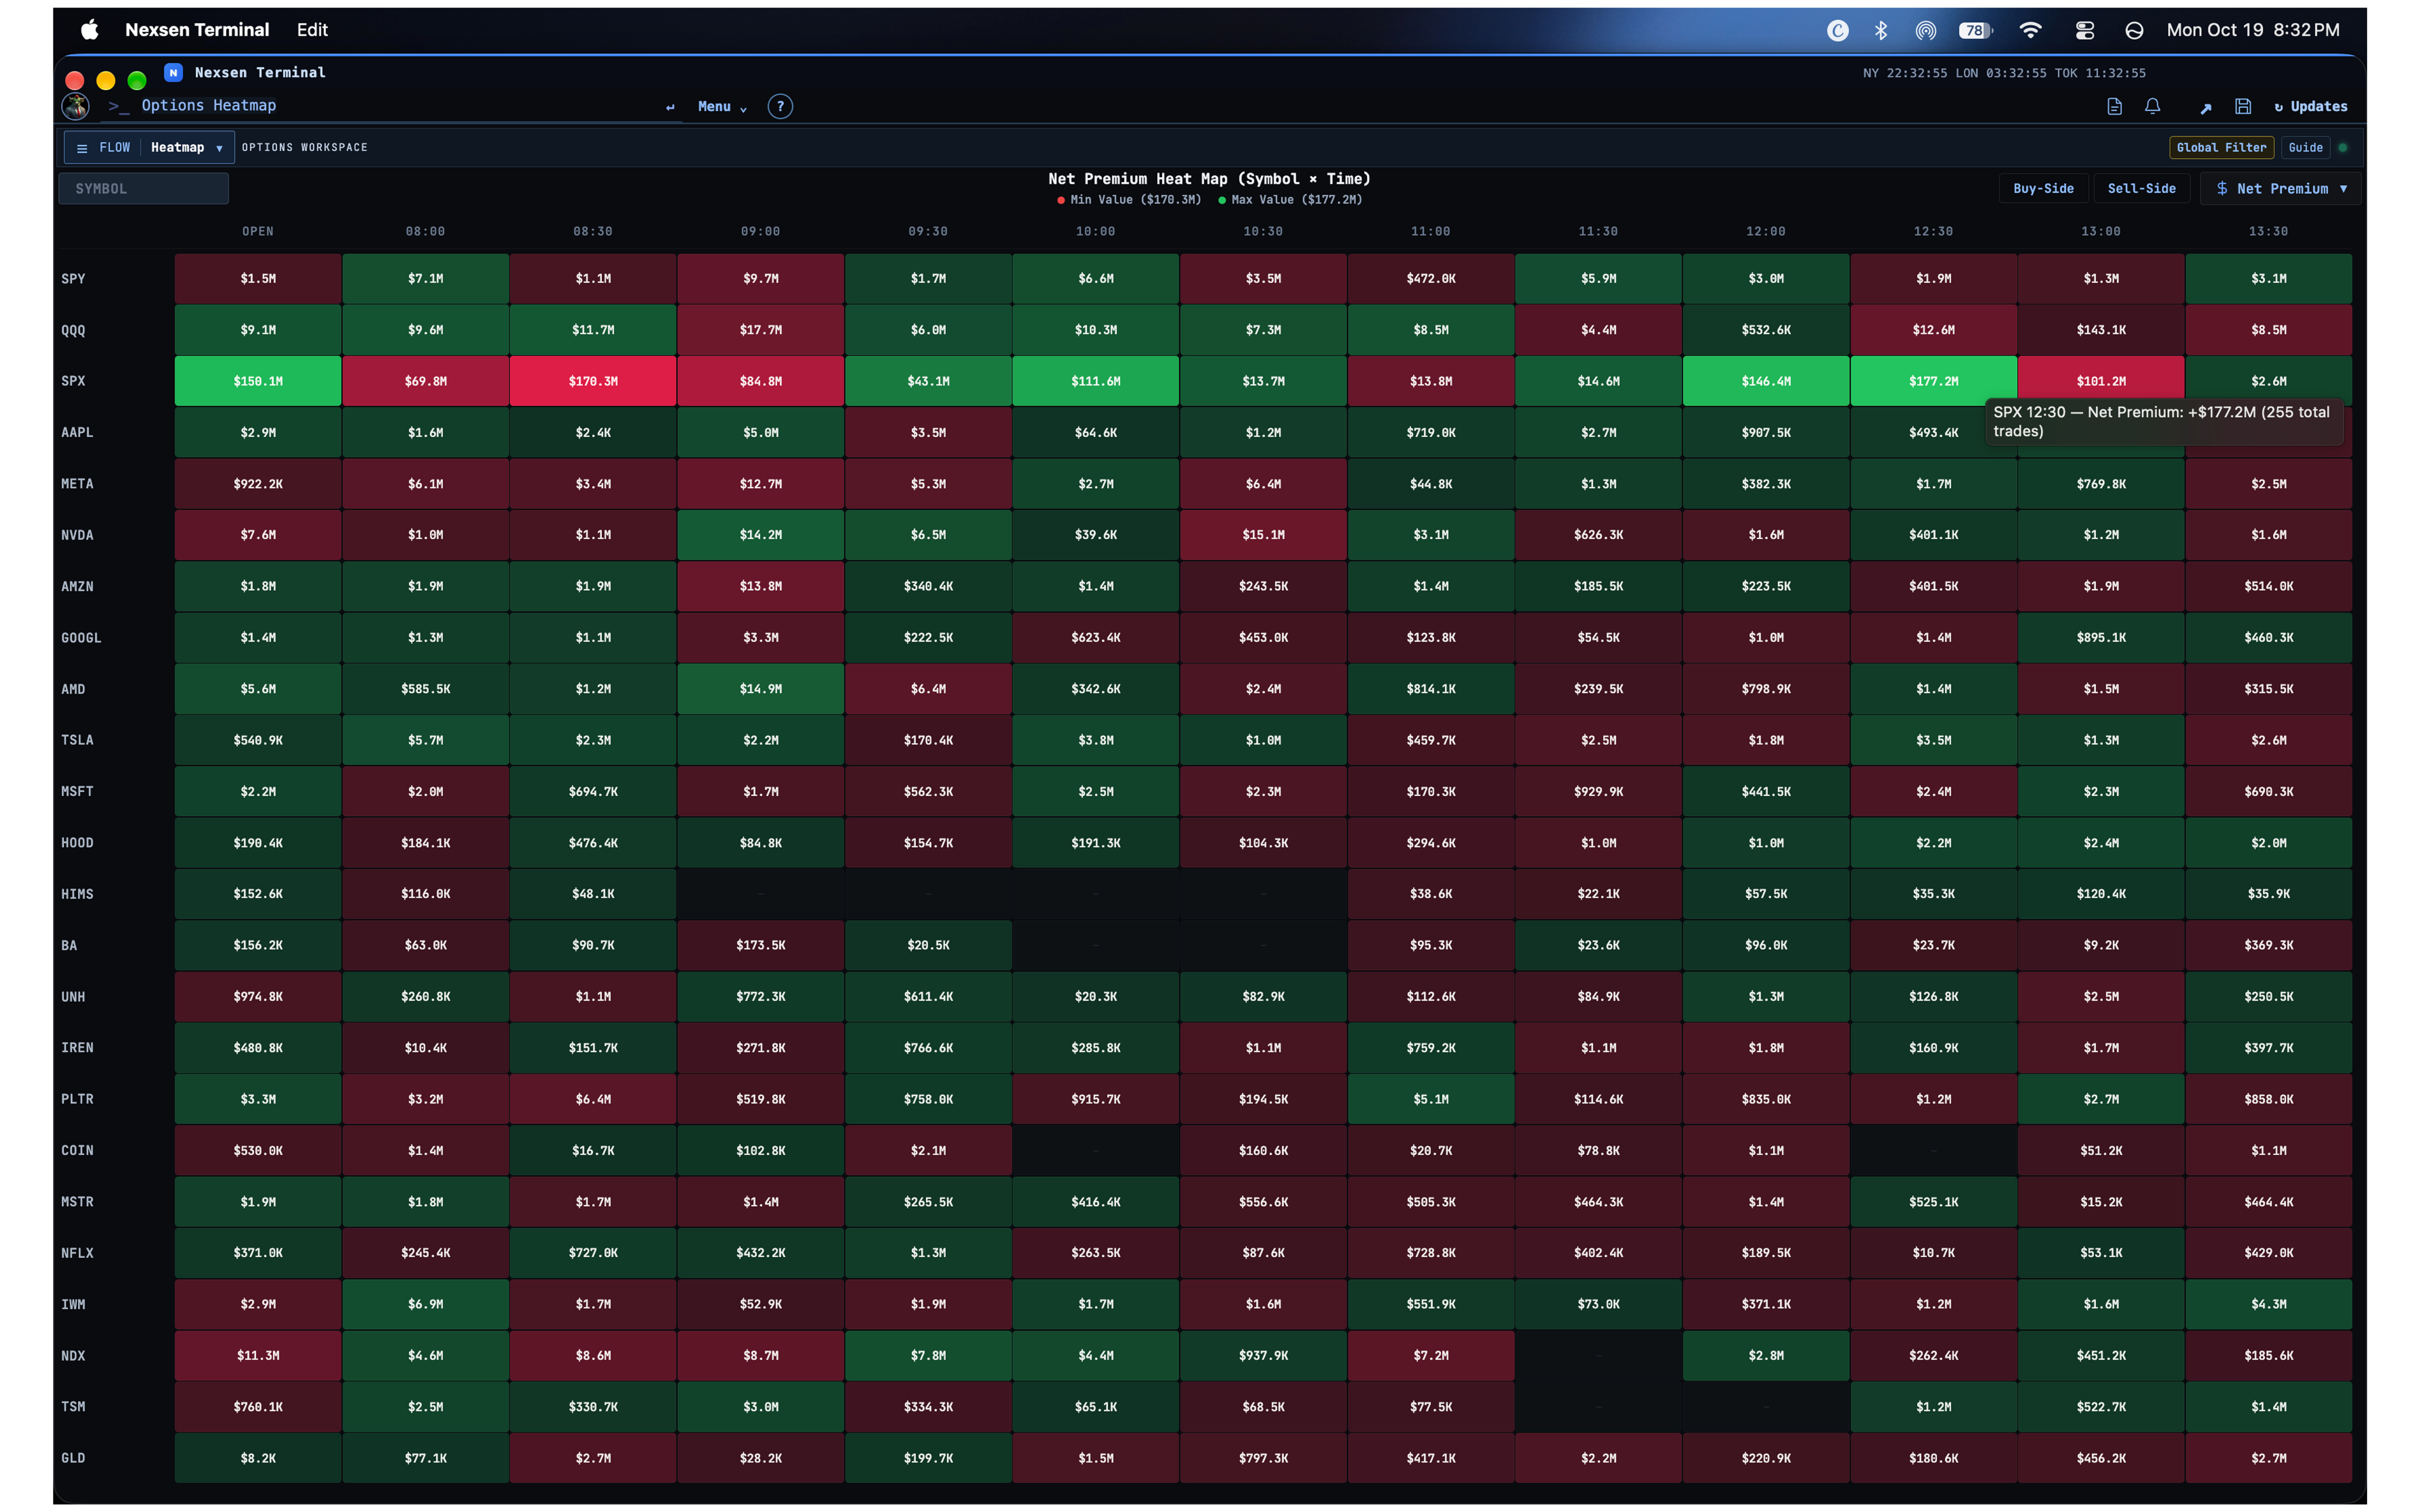
See where attention concentrates.
Scan activity across symbols and time intervals, then focus on the pockets of flow that deserve a closer look.
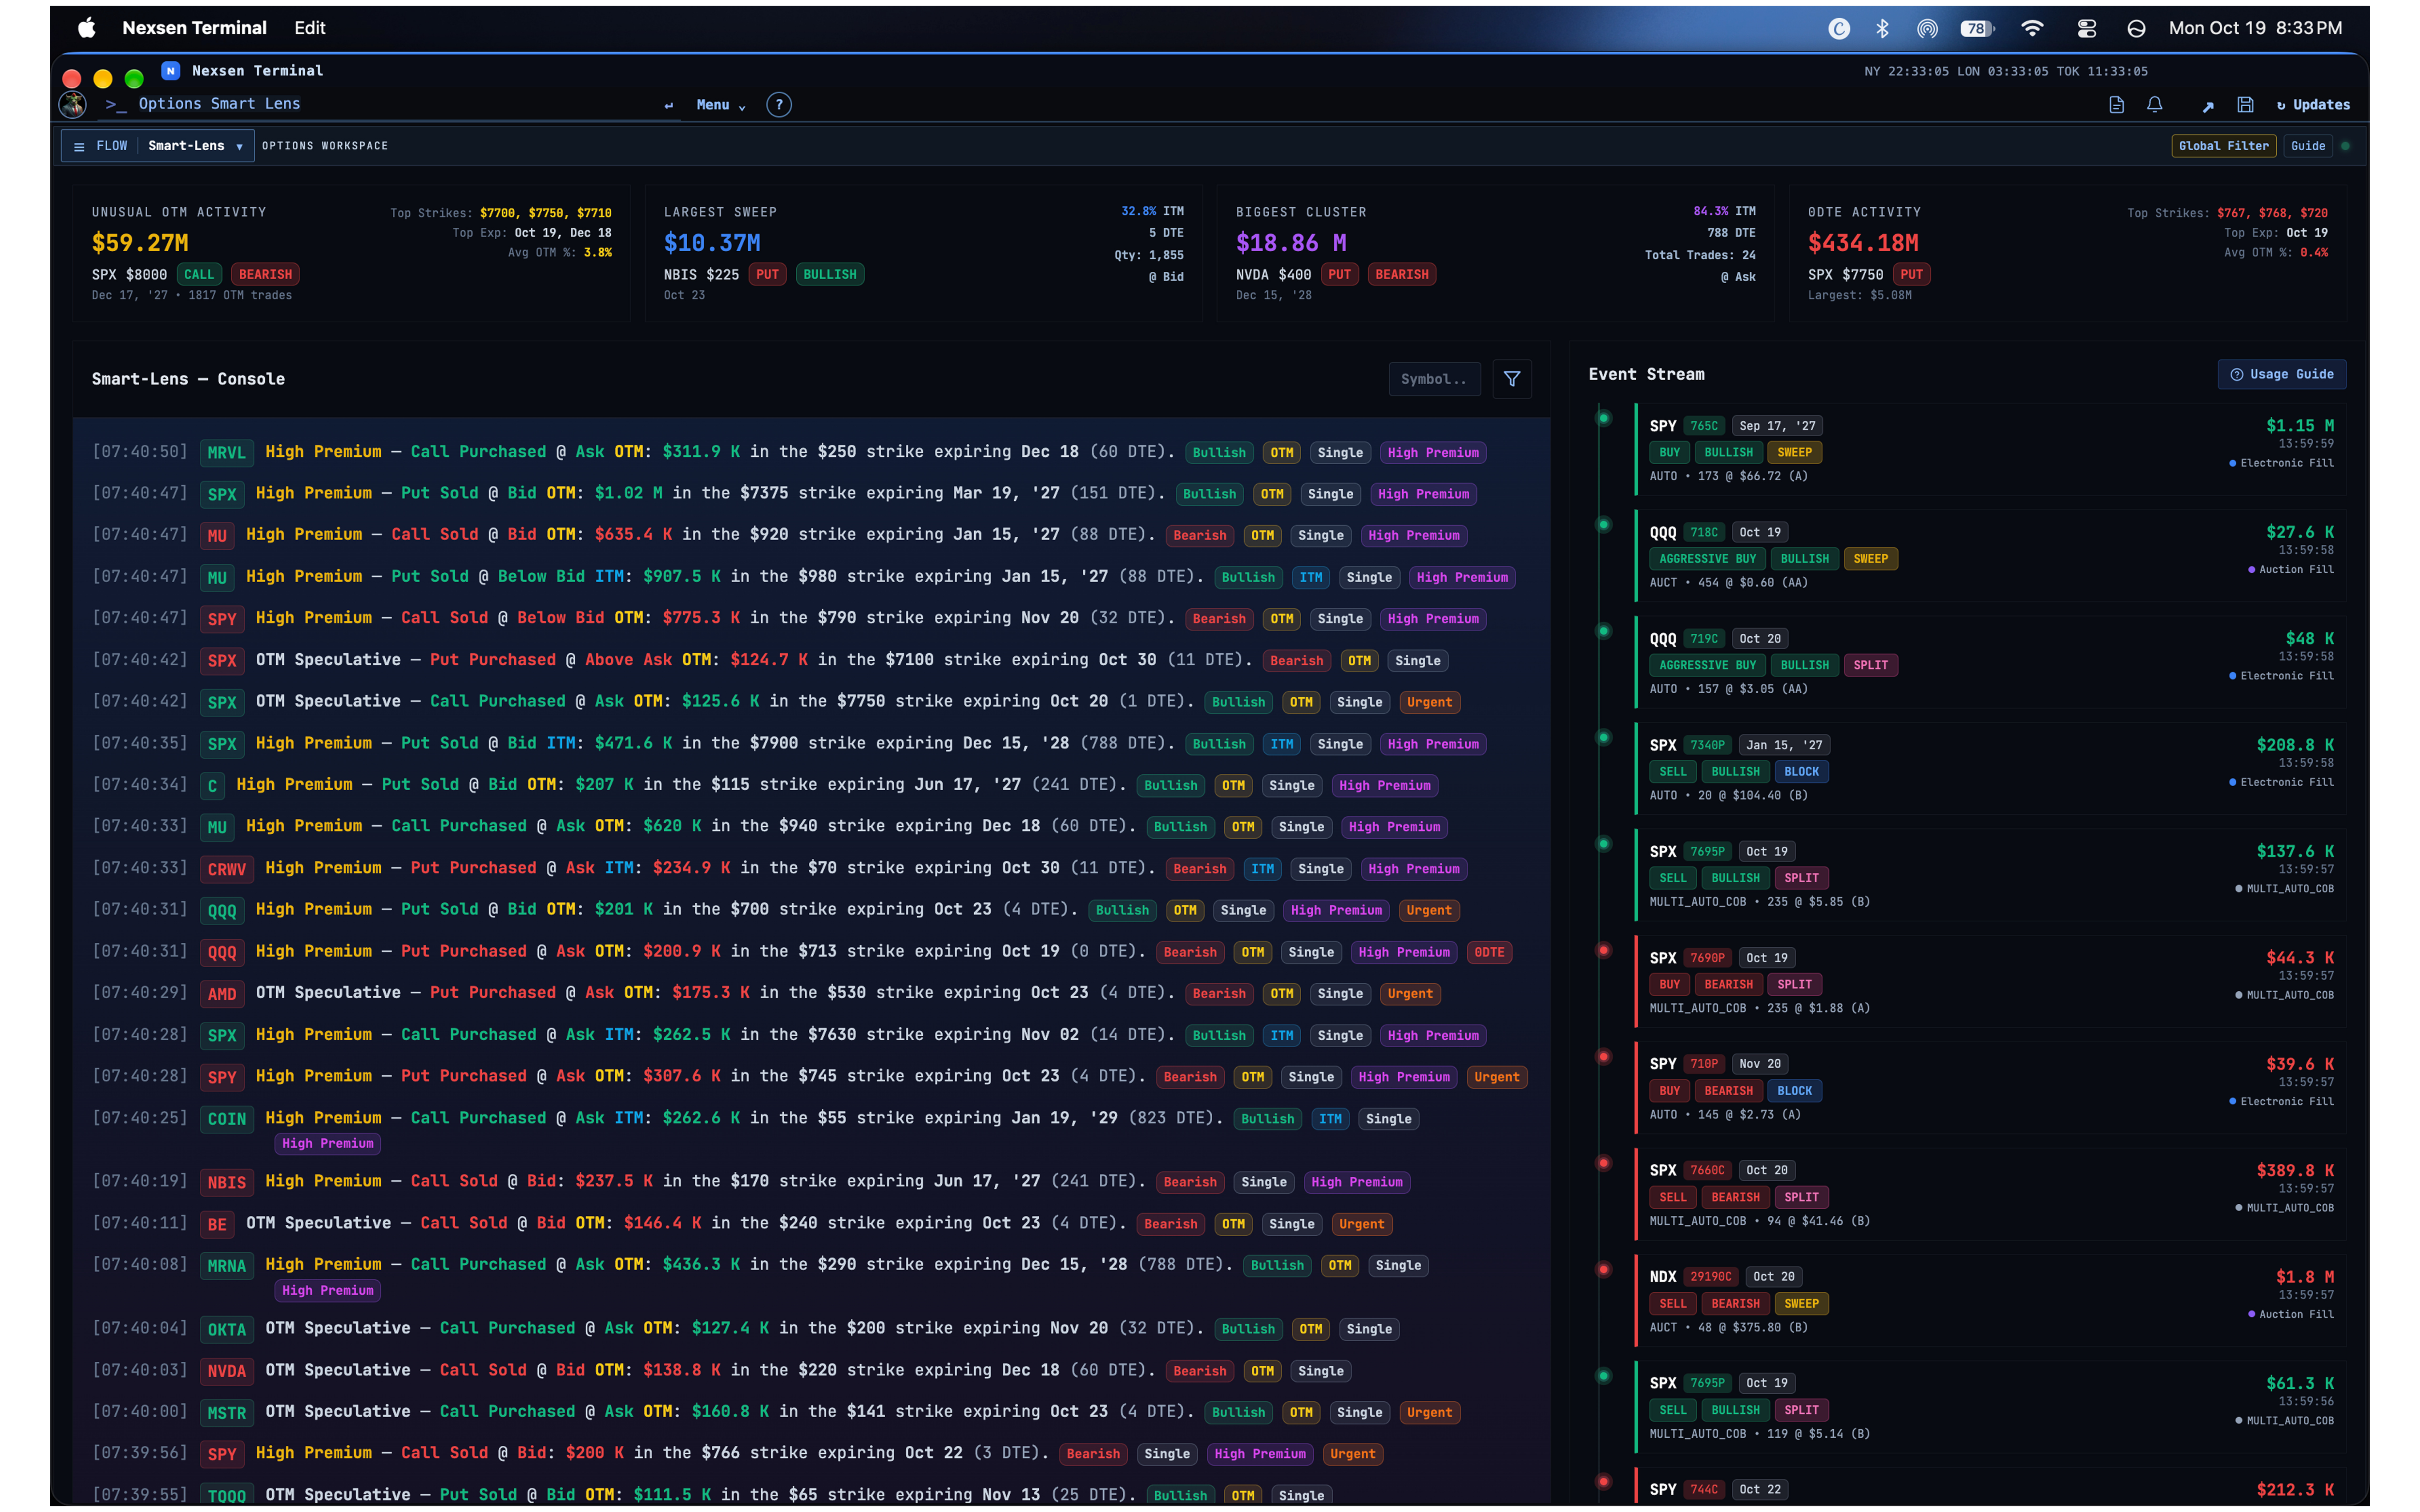
Find the patterns within the prints.
Investigate sweeps, blocks and clusters with filters that help turn a busy transaction stream into a focused research view.
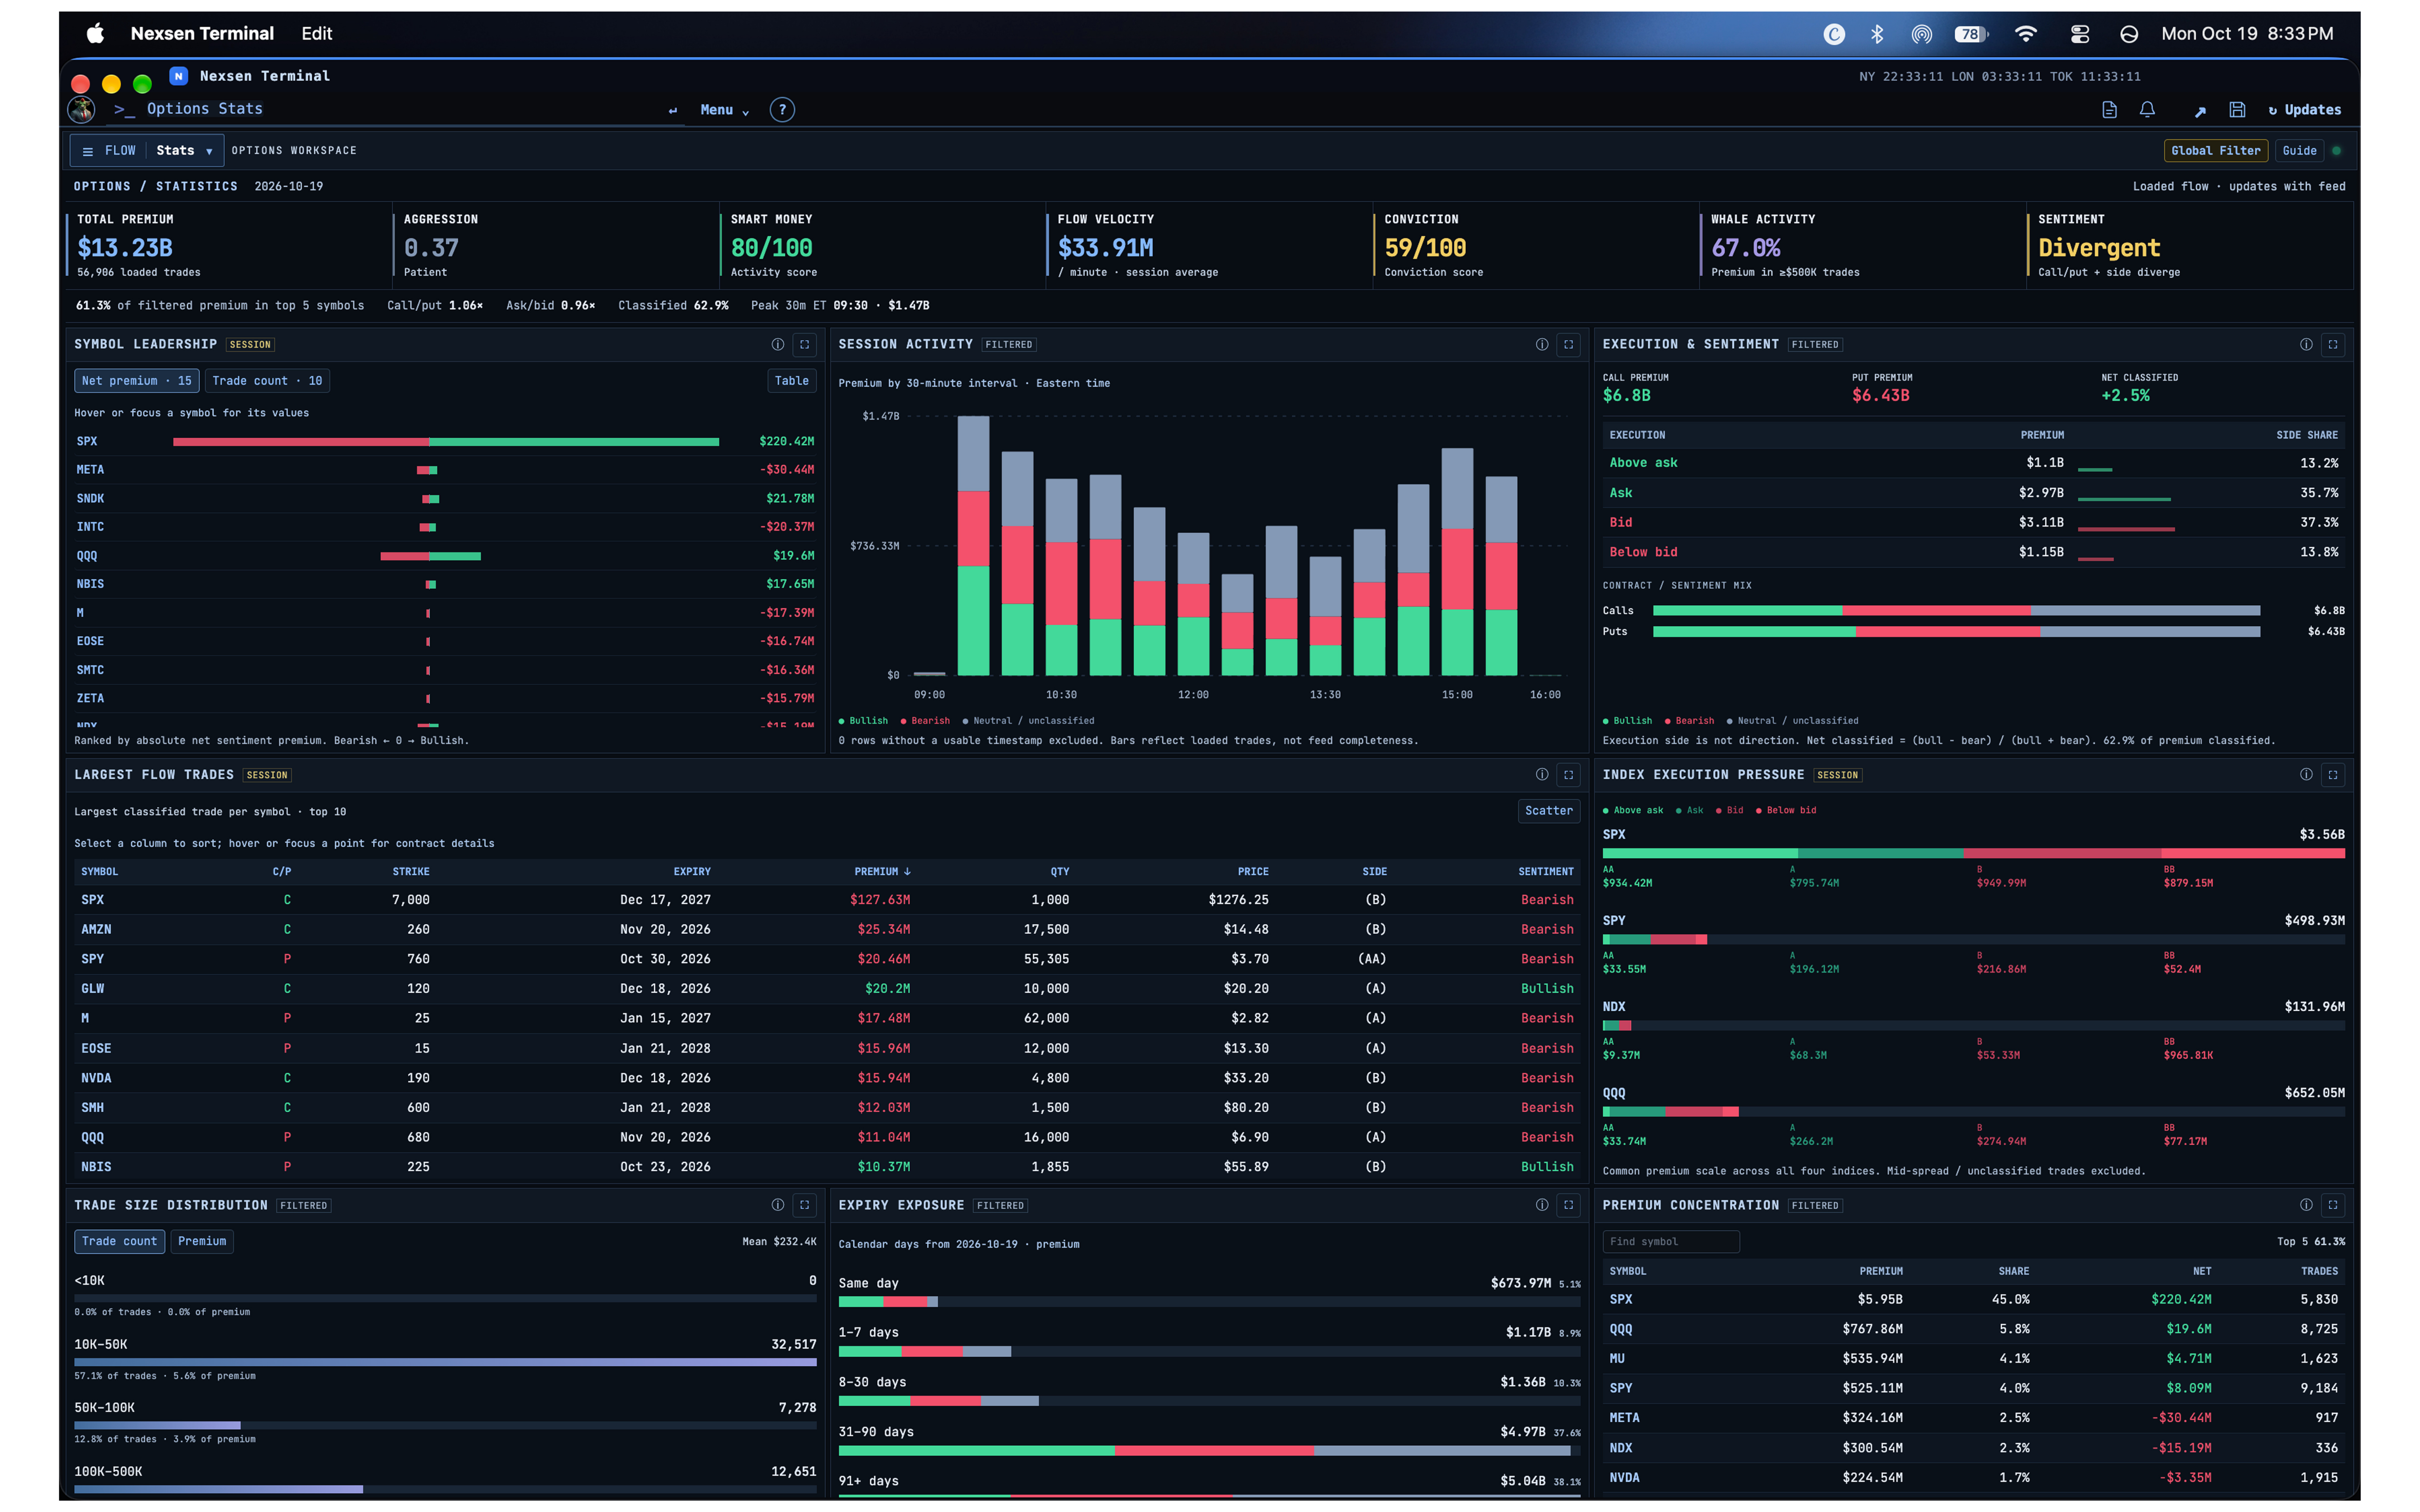
Put the session into perspective.
Compare activity, premium and participation across the options market before drilling into a symbol or transaction.
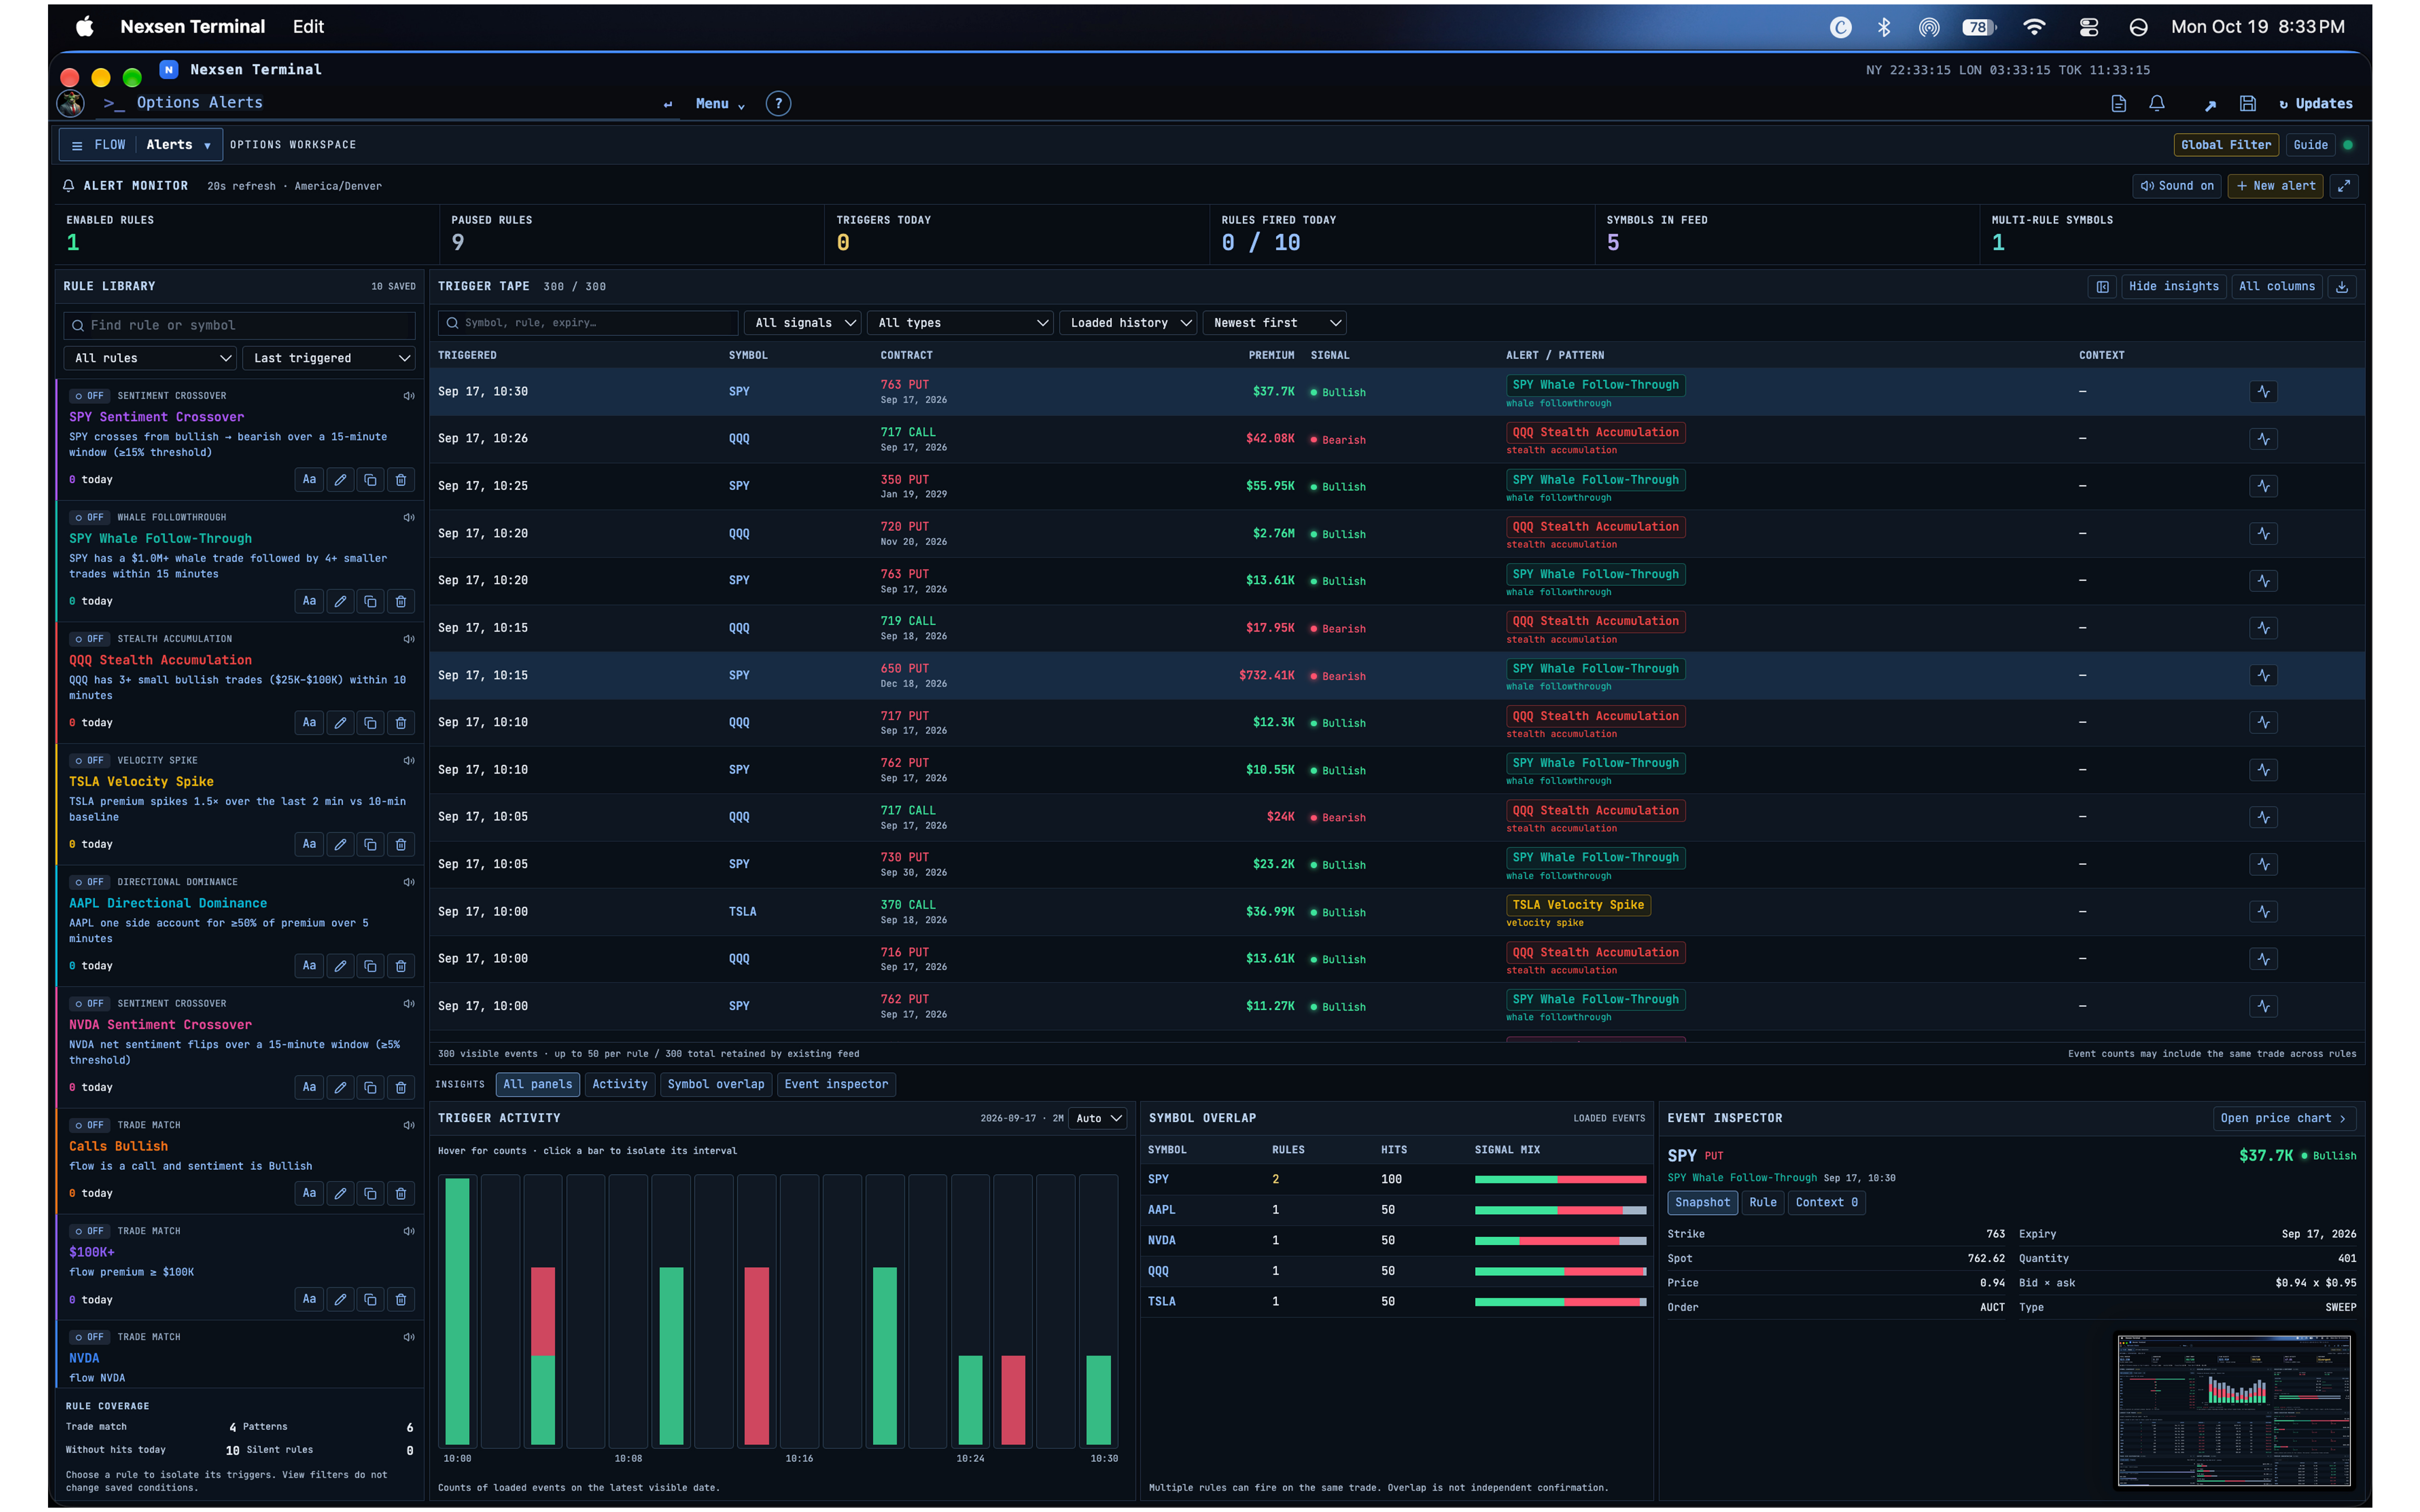
Let the activity come to you.
Configure the patterns and conditions you want to follow, then review the trades behind each alert when it triggers.
 Back to platform index
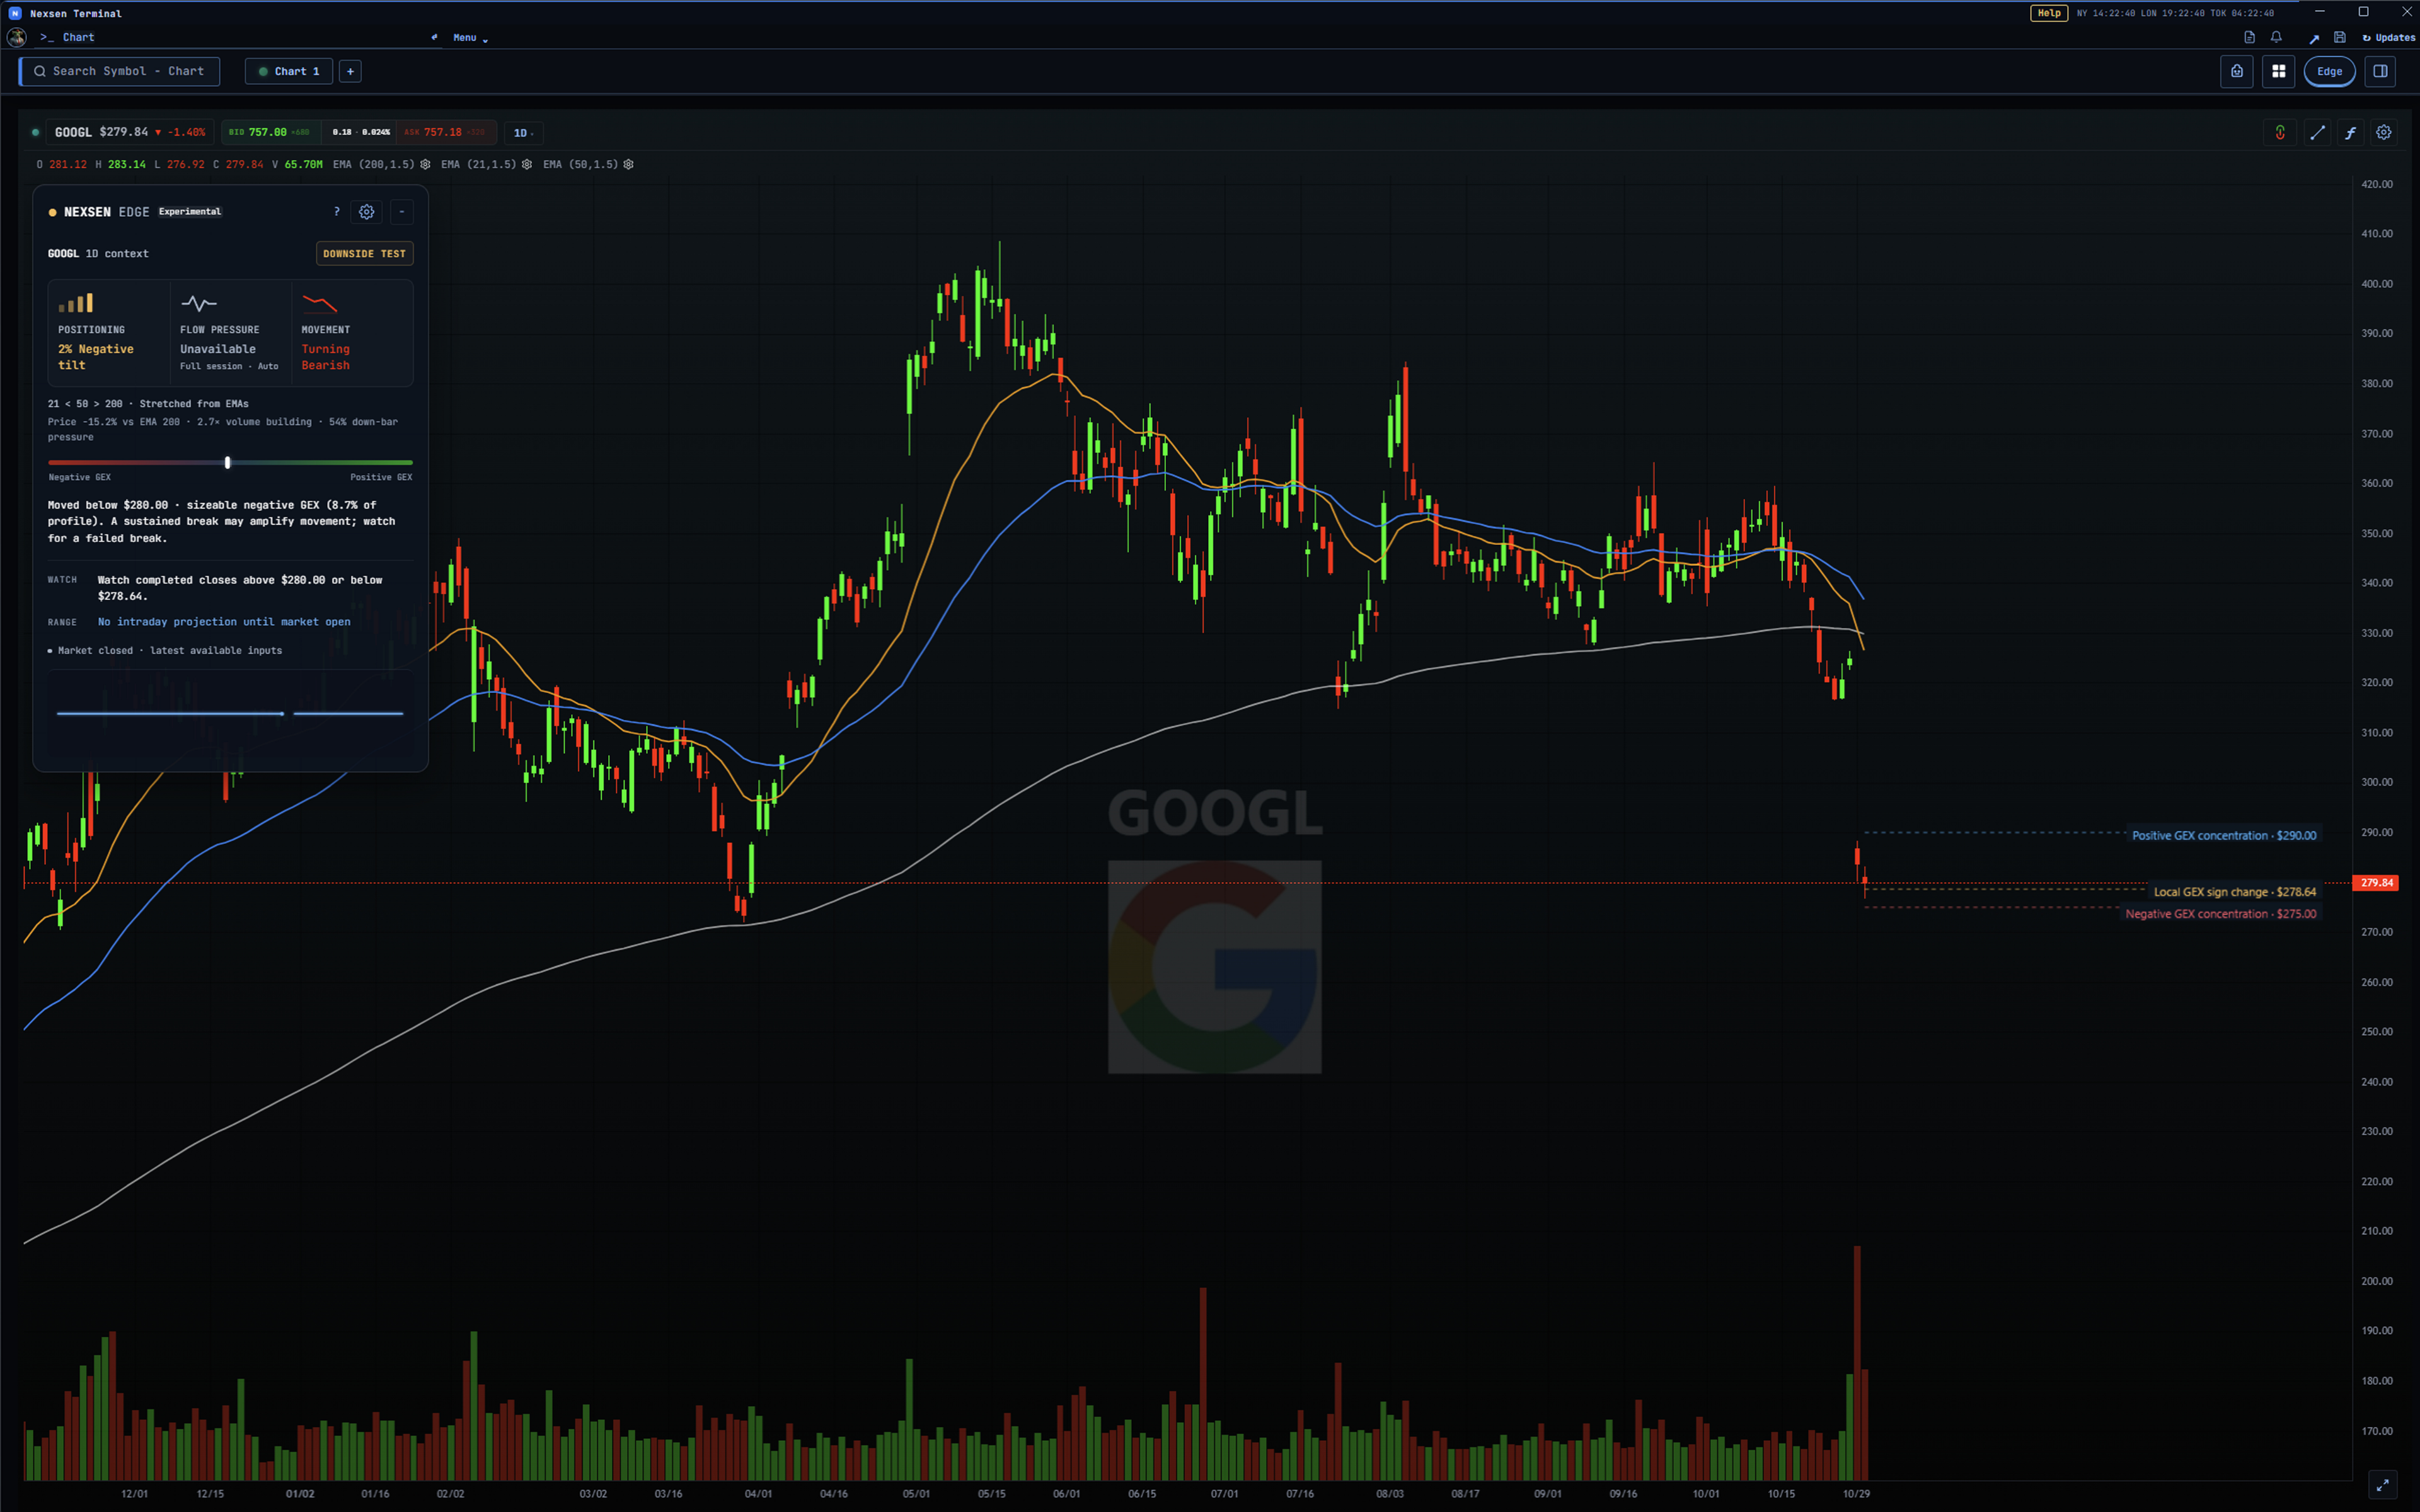
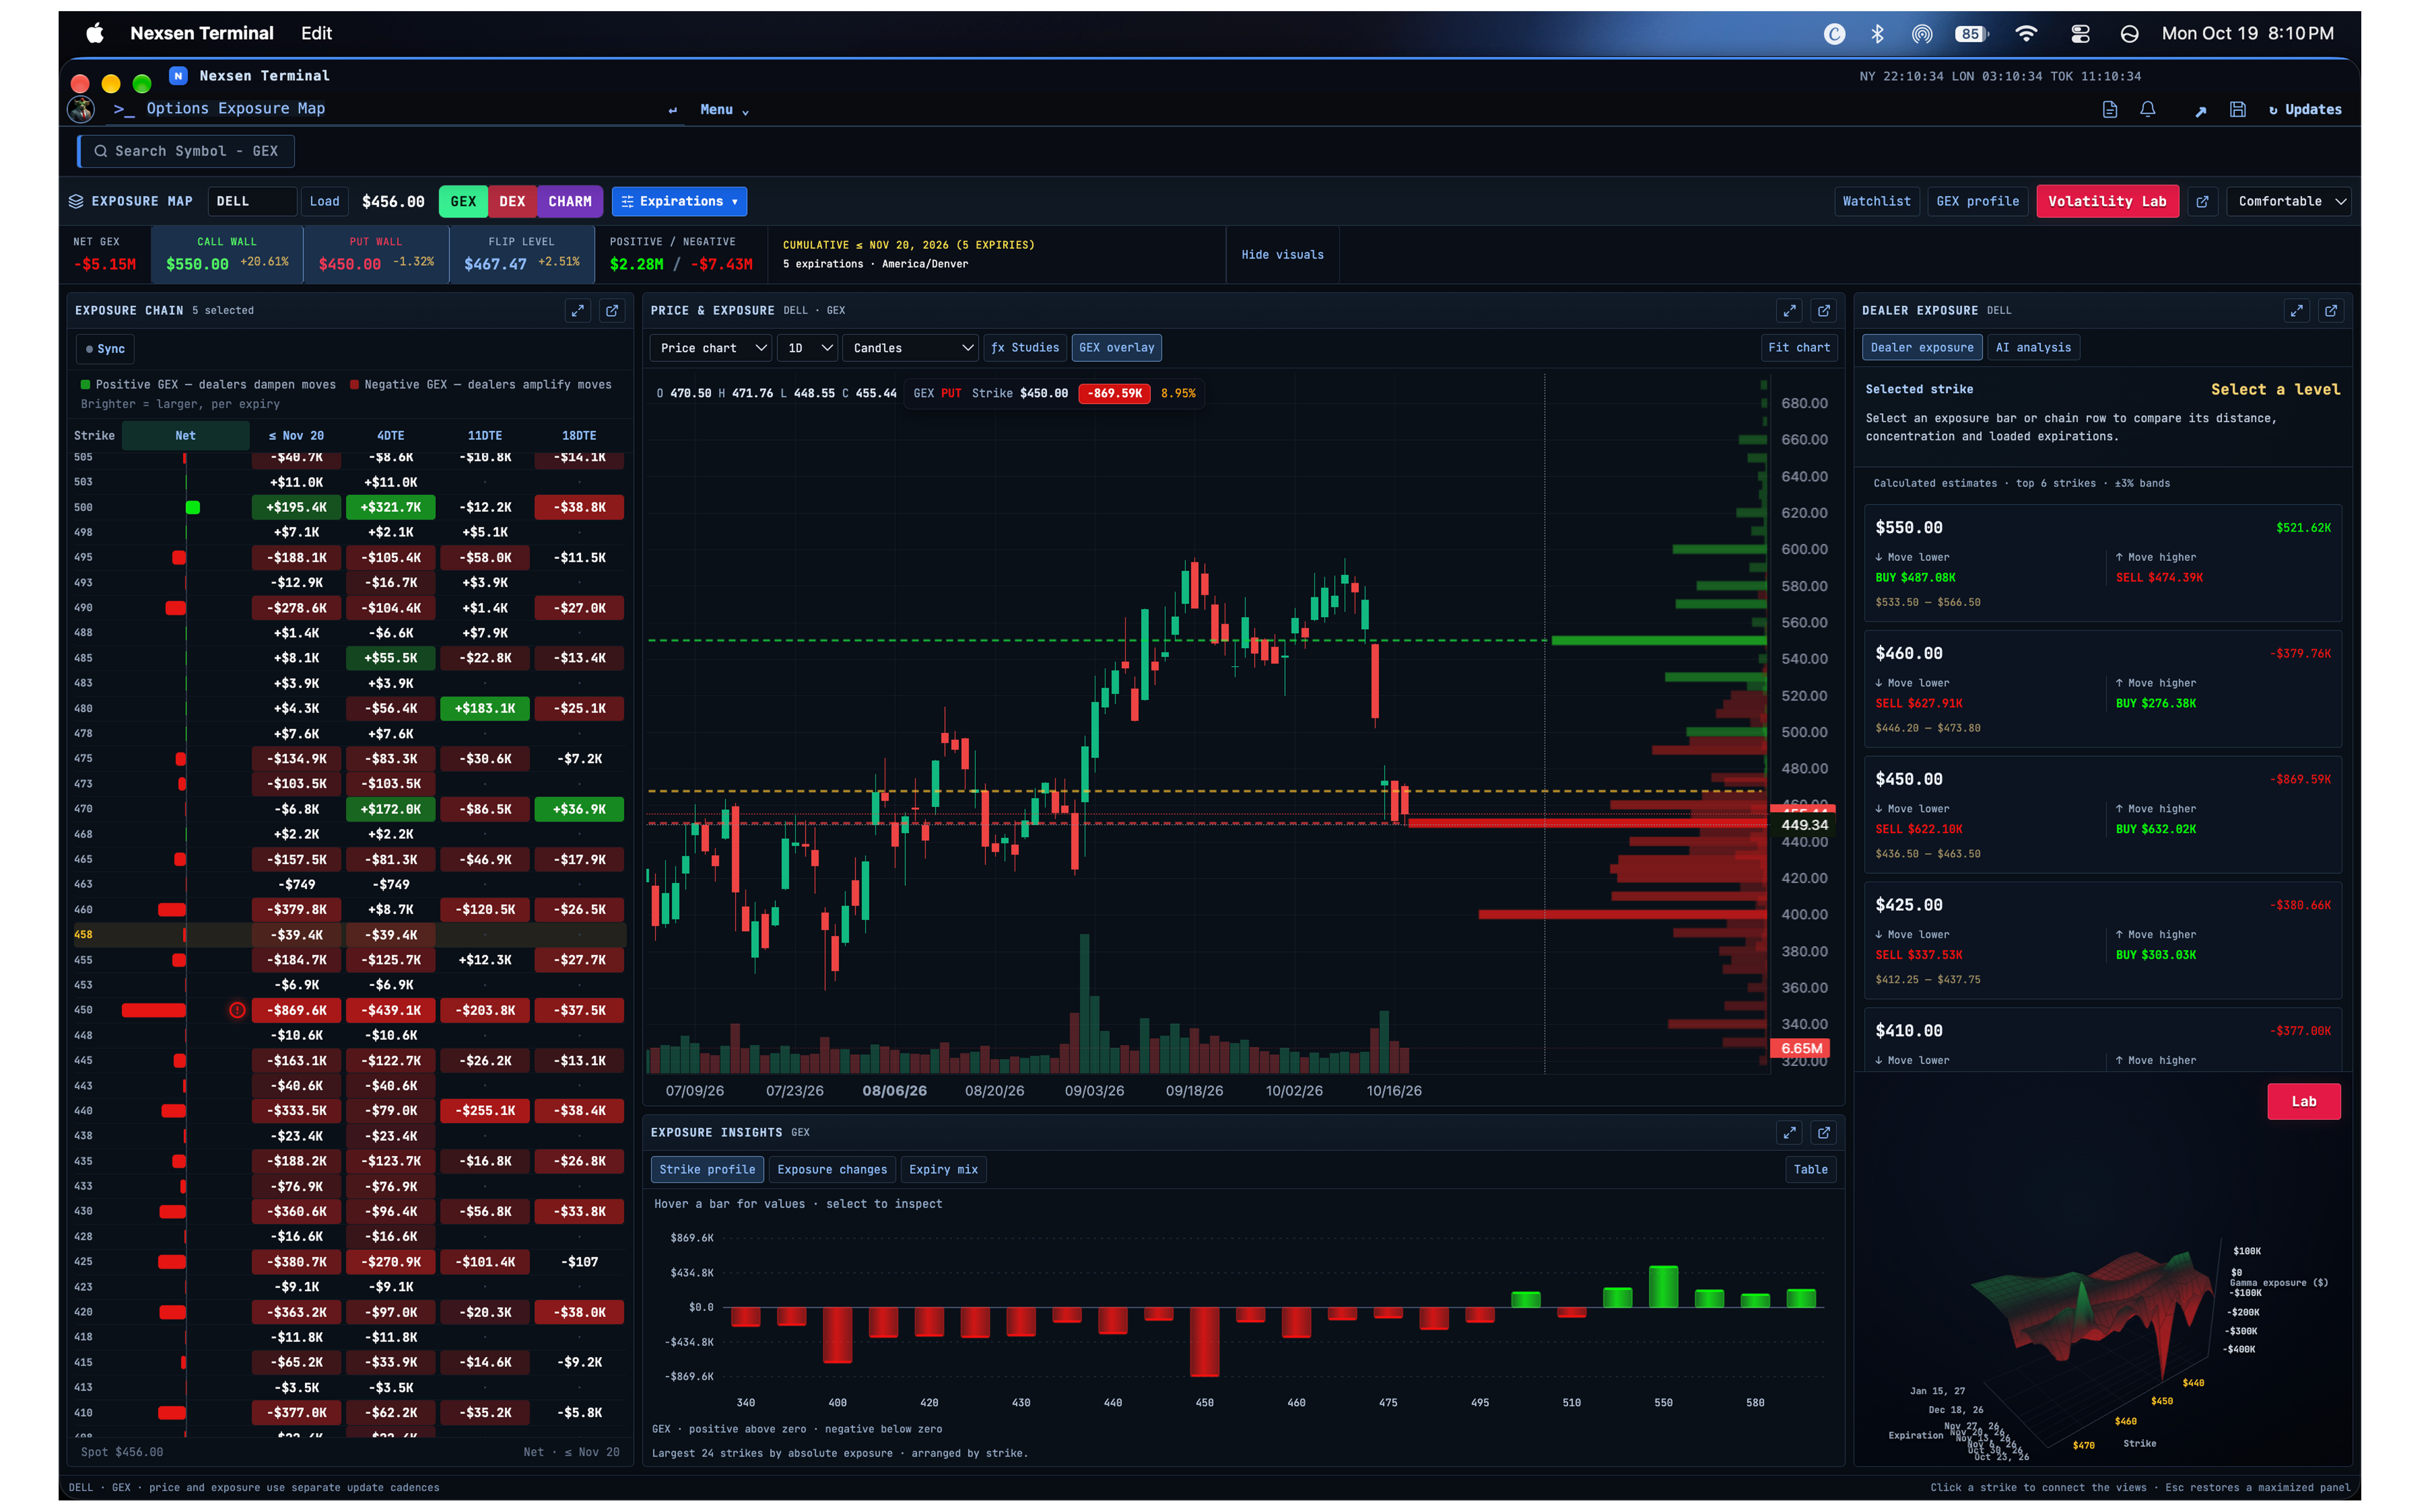
Bring positioning alongside price.
Explore GEX, DEX and charm across strikes and expirations. Compare exposure levels with the chart and investigate the positioning around spot.
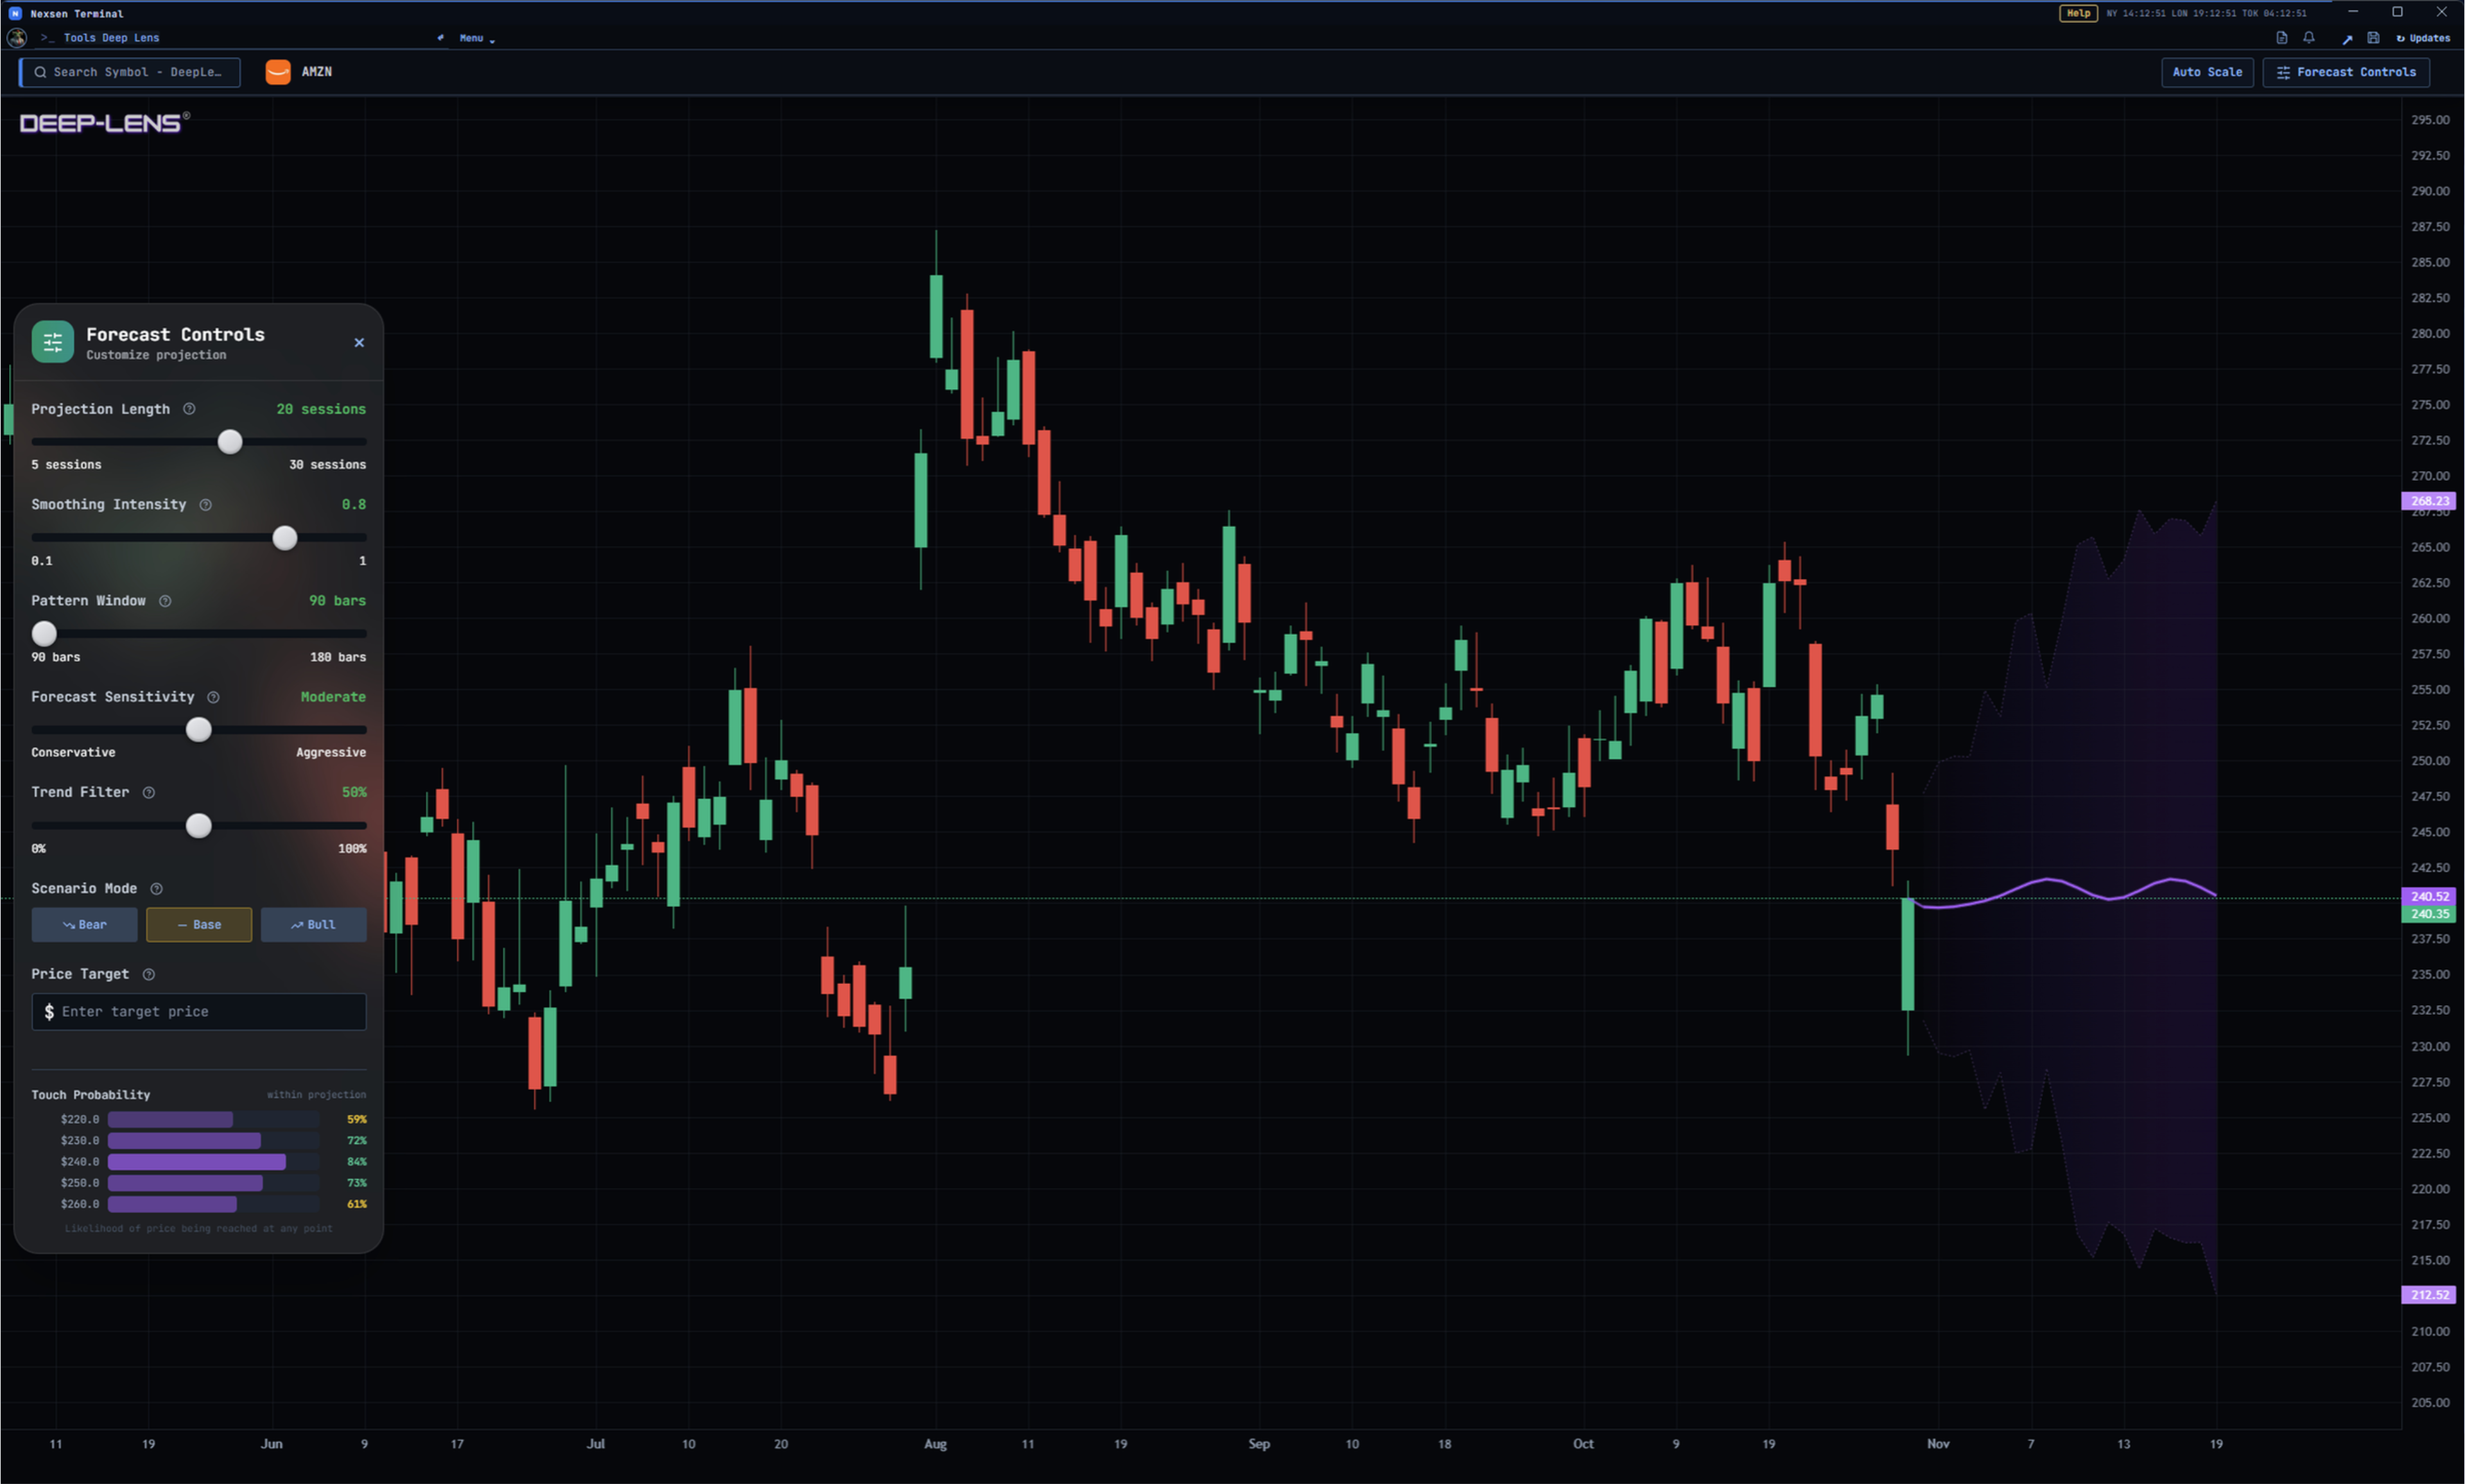
Explore the paths ahead.
Keep modeled projections on the chart. Adjust the forecast controls, compare scenarios and examine the range of possible outcomes.
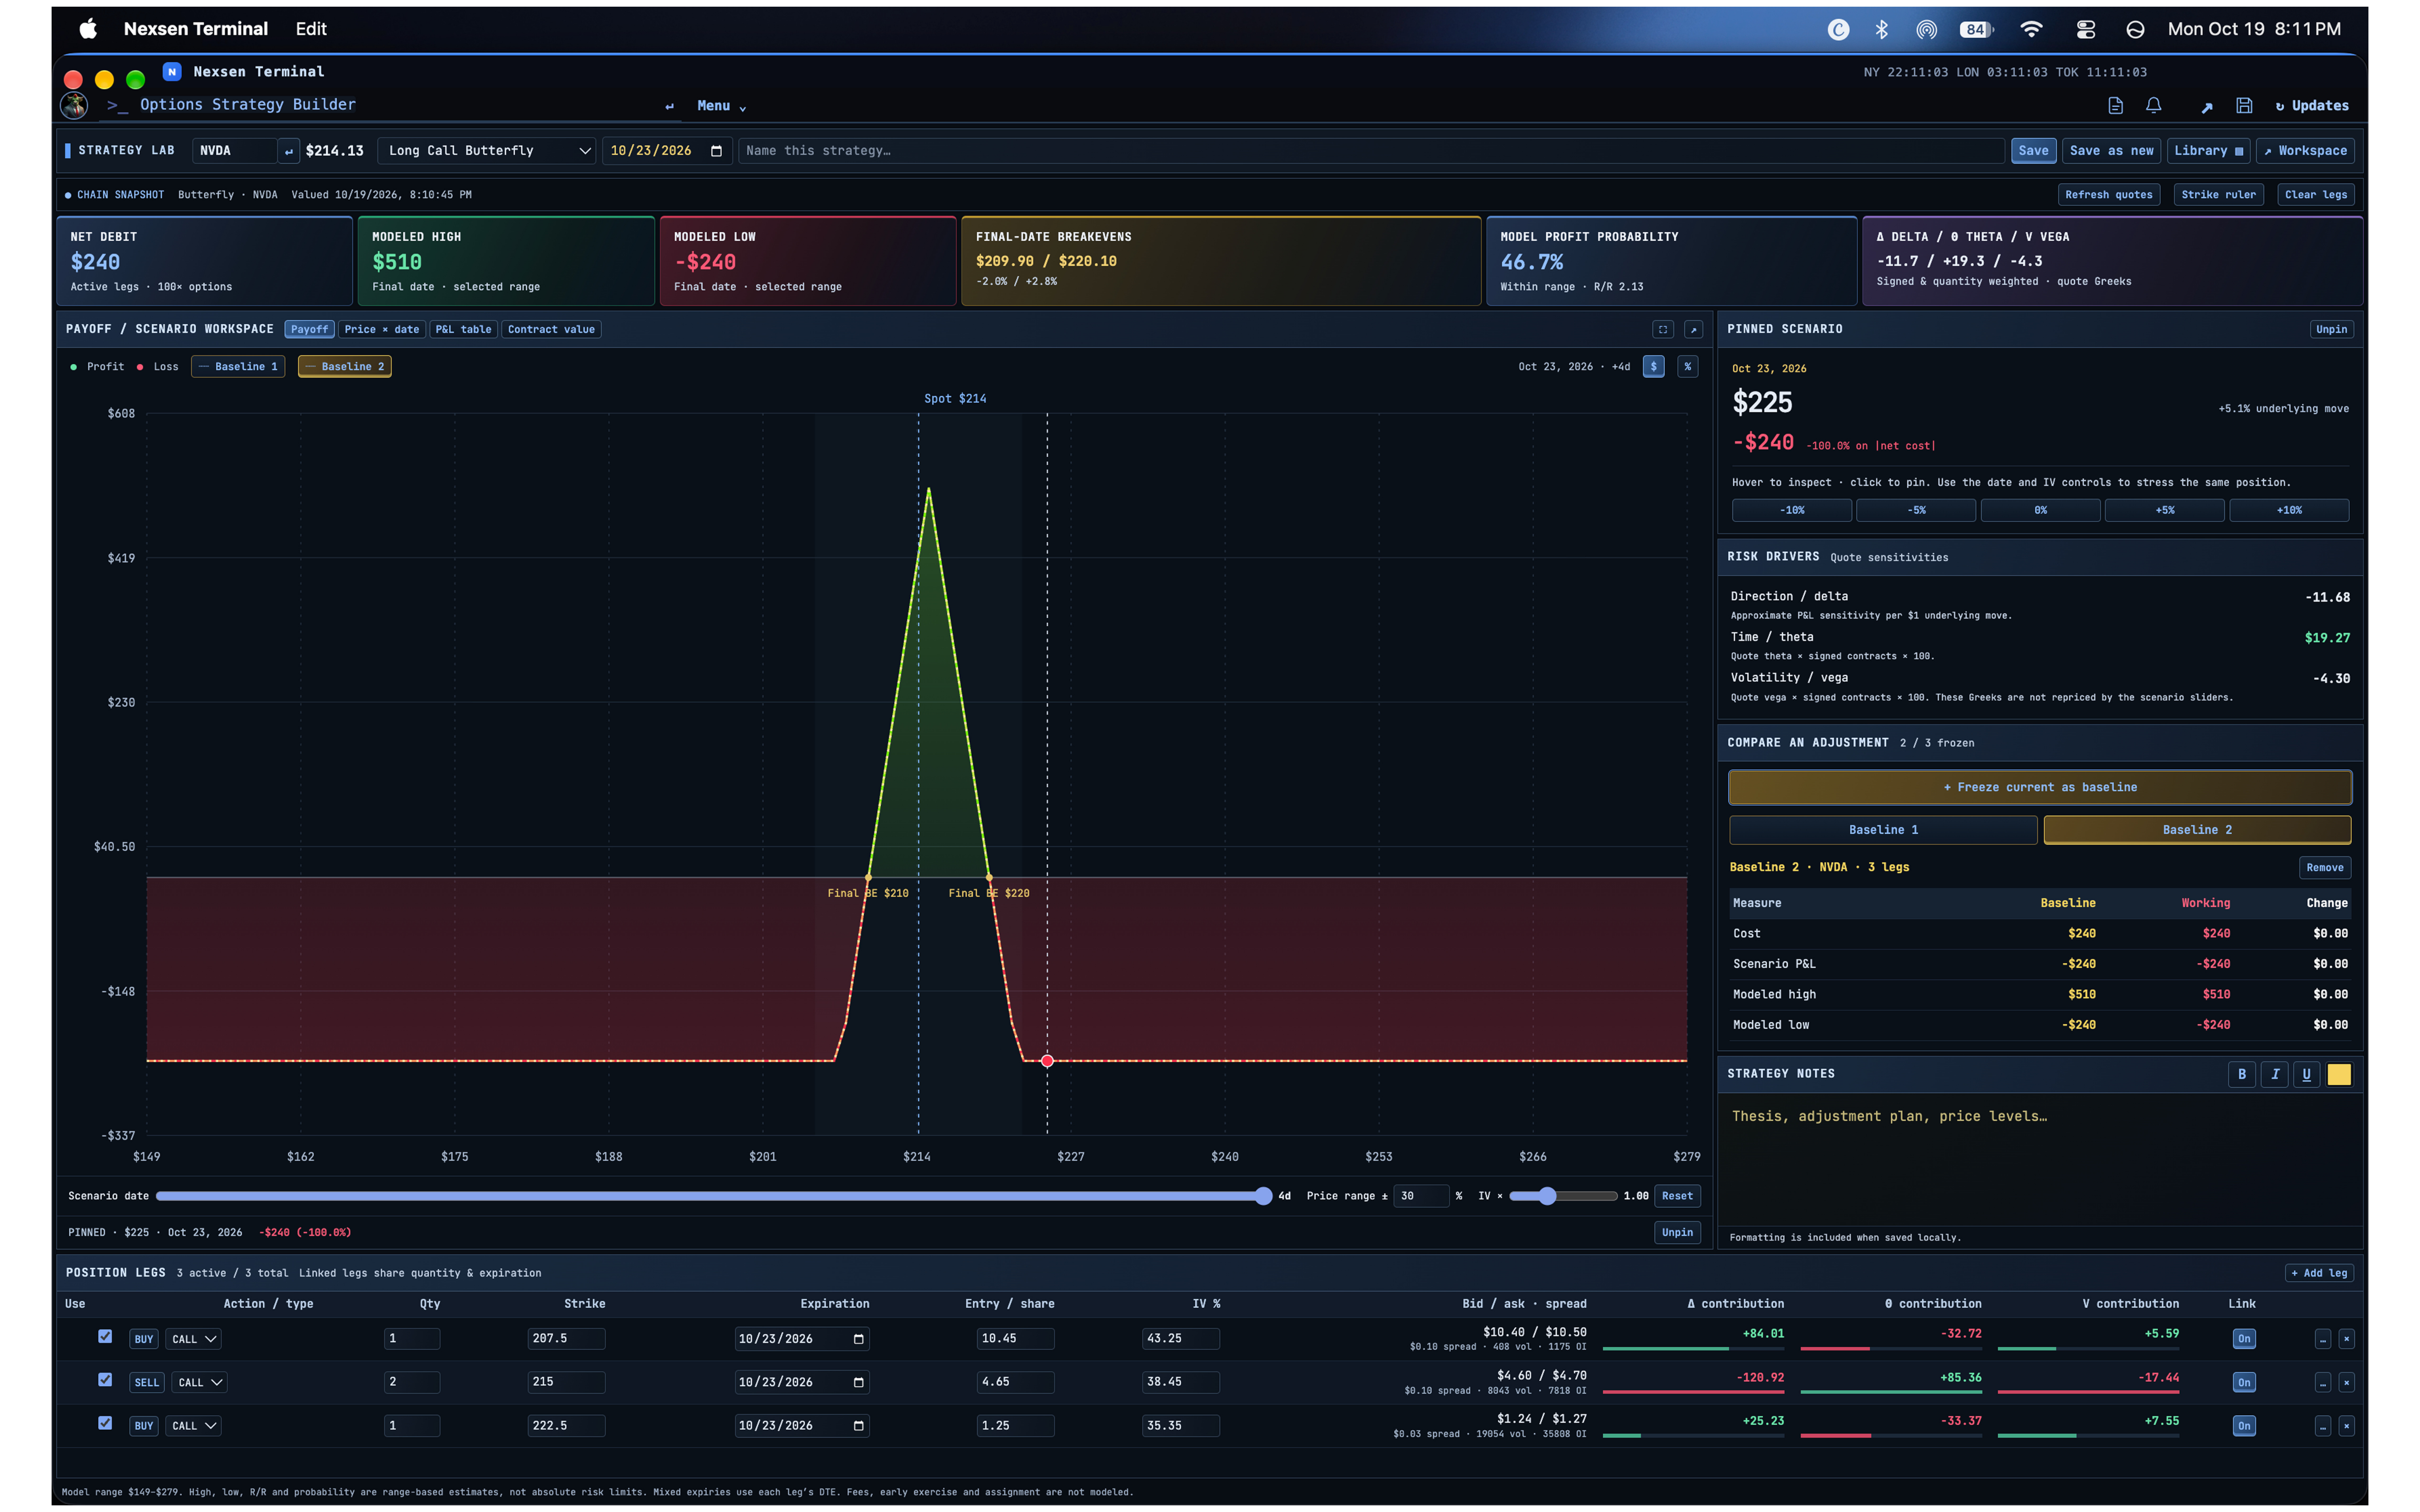
Turn a thesis into a scenario.
Build options strategies and compare modeled payoff, risk and sensitivity as you adjust the underlying assumptions.
 Back to platform index
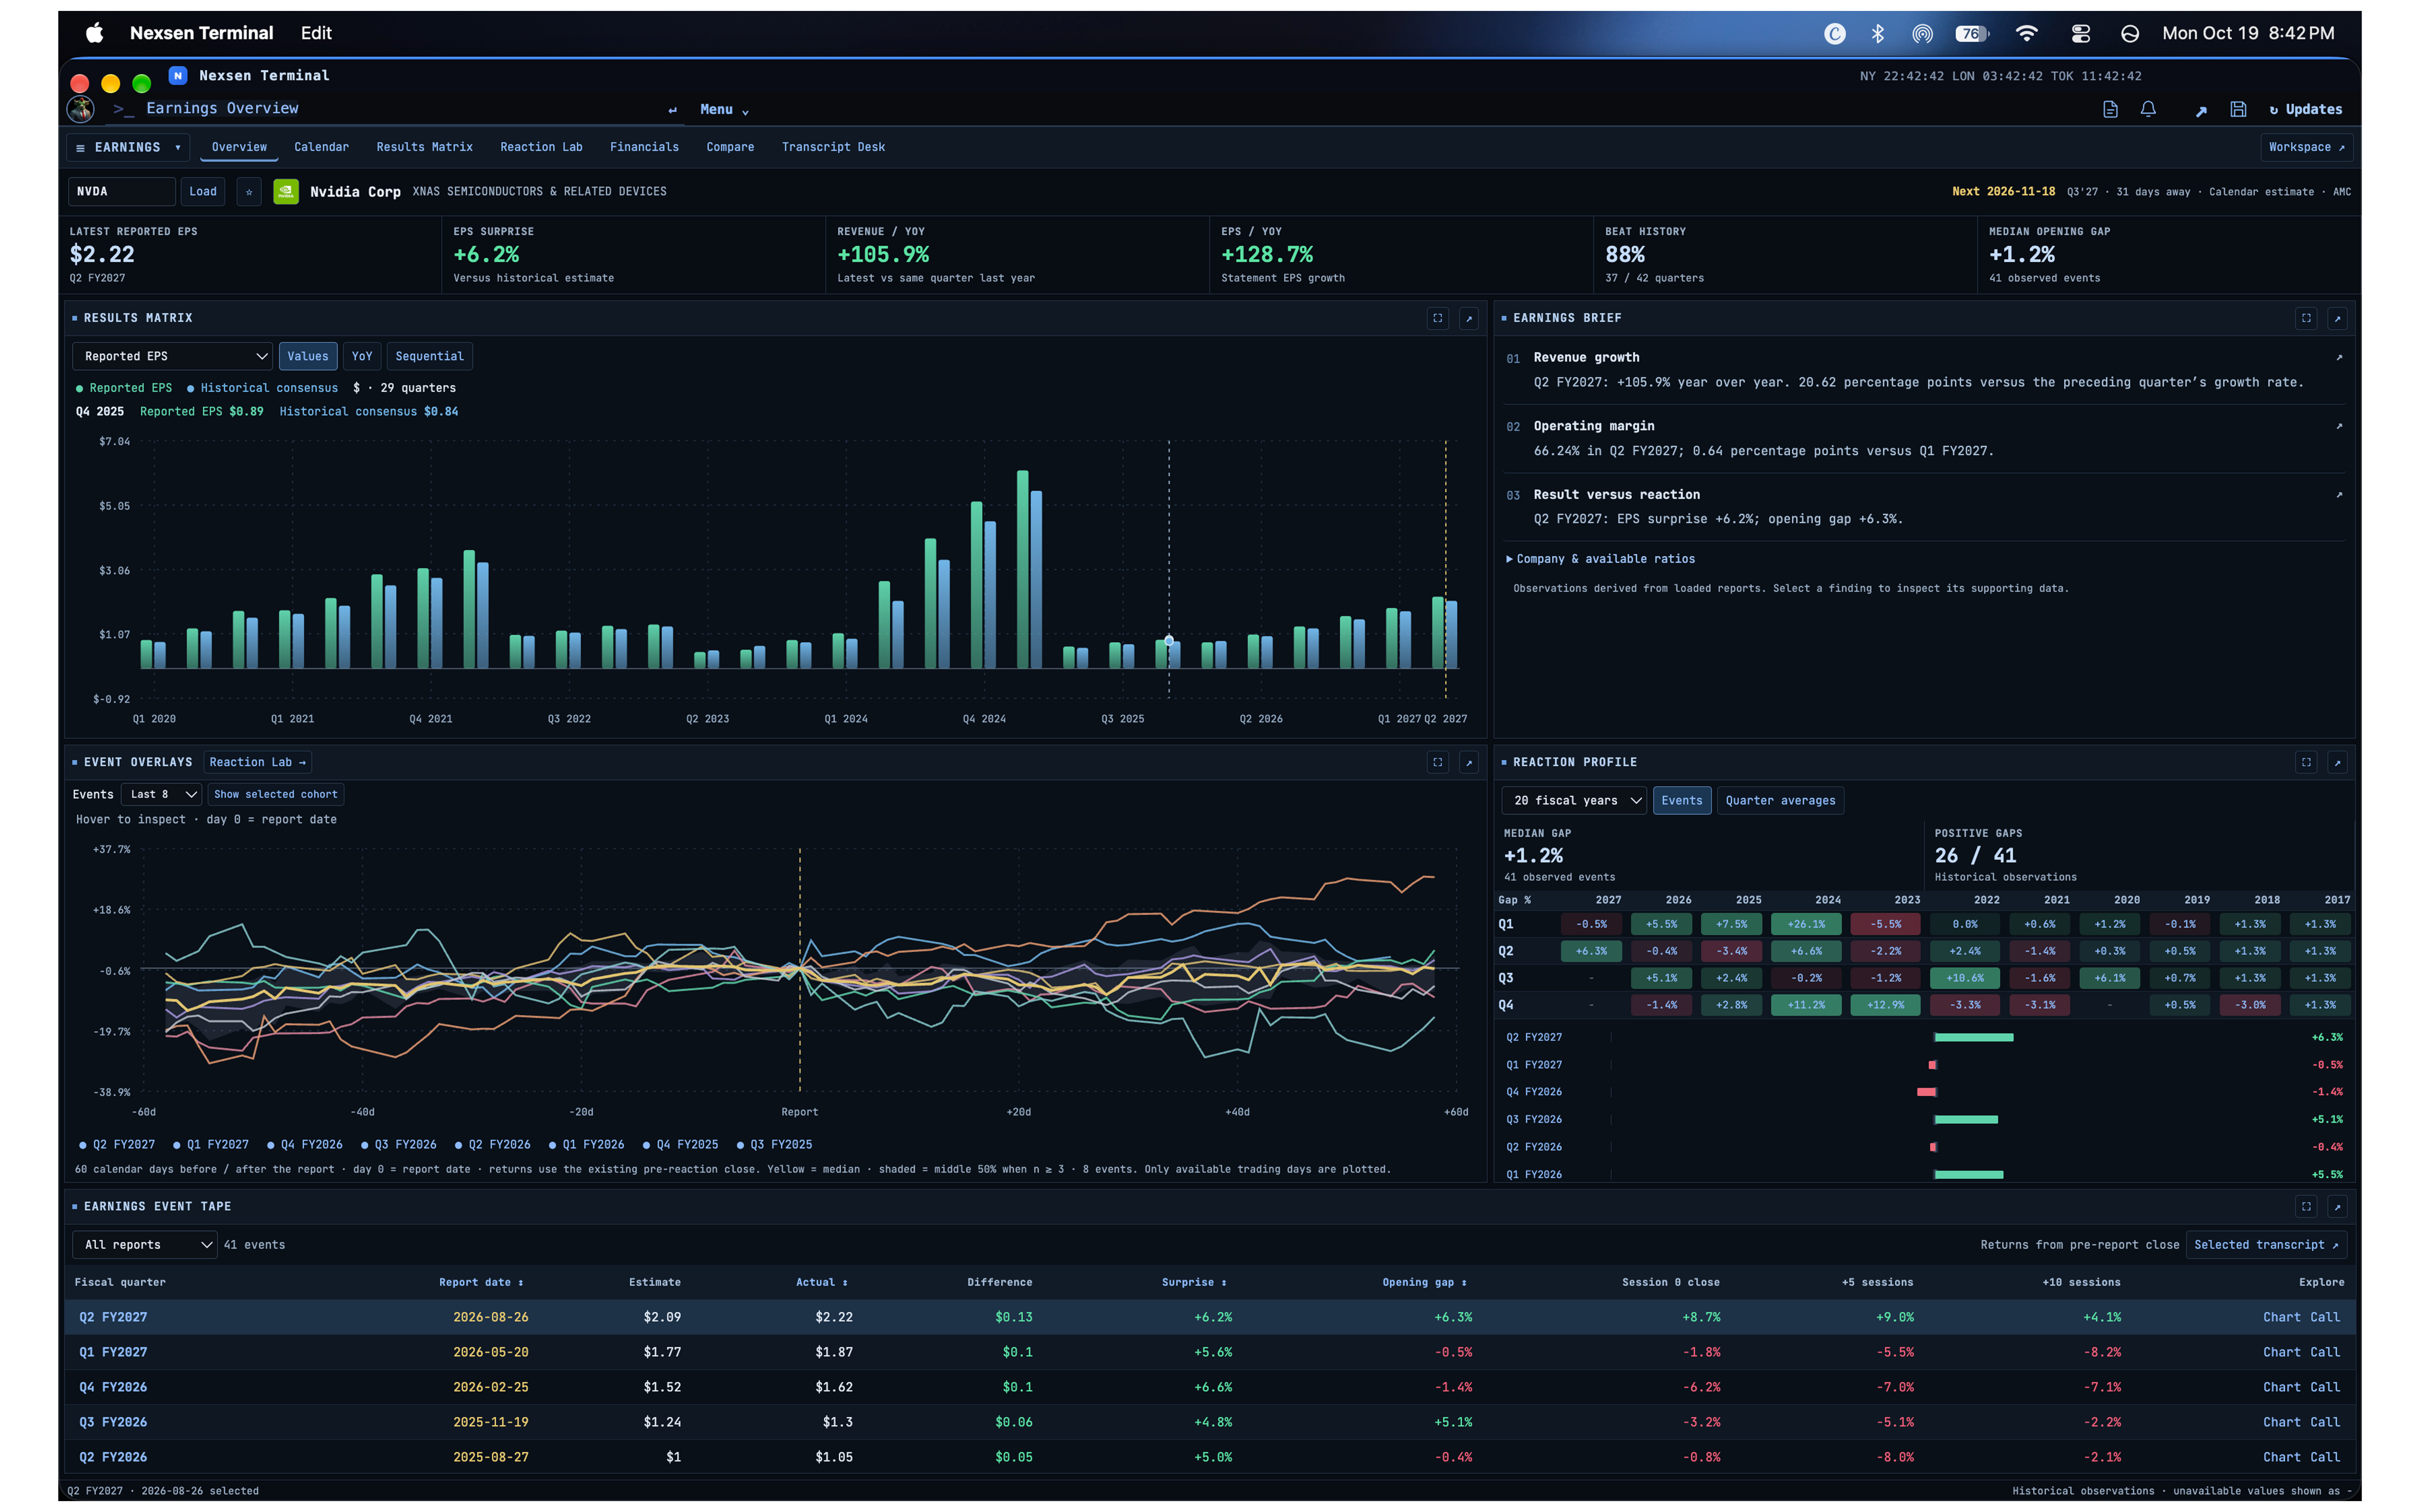
Keep the whole report in reach.
Bring the calendar, company results and reaction research into a single earnings workflow, from preparation to follow-through.
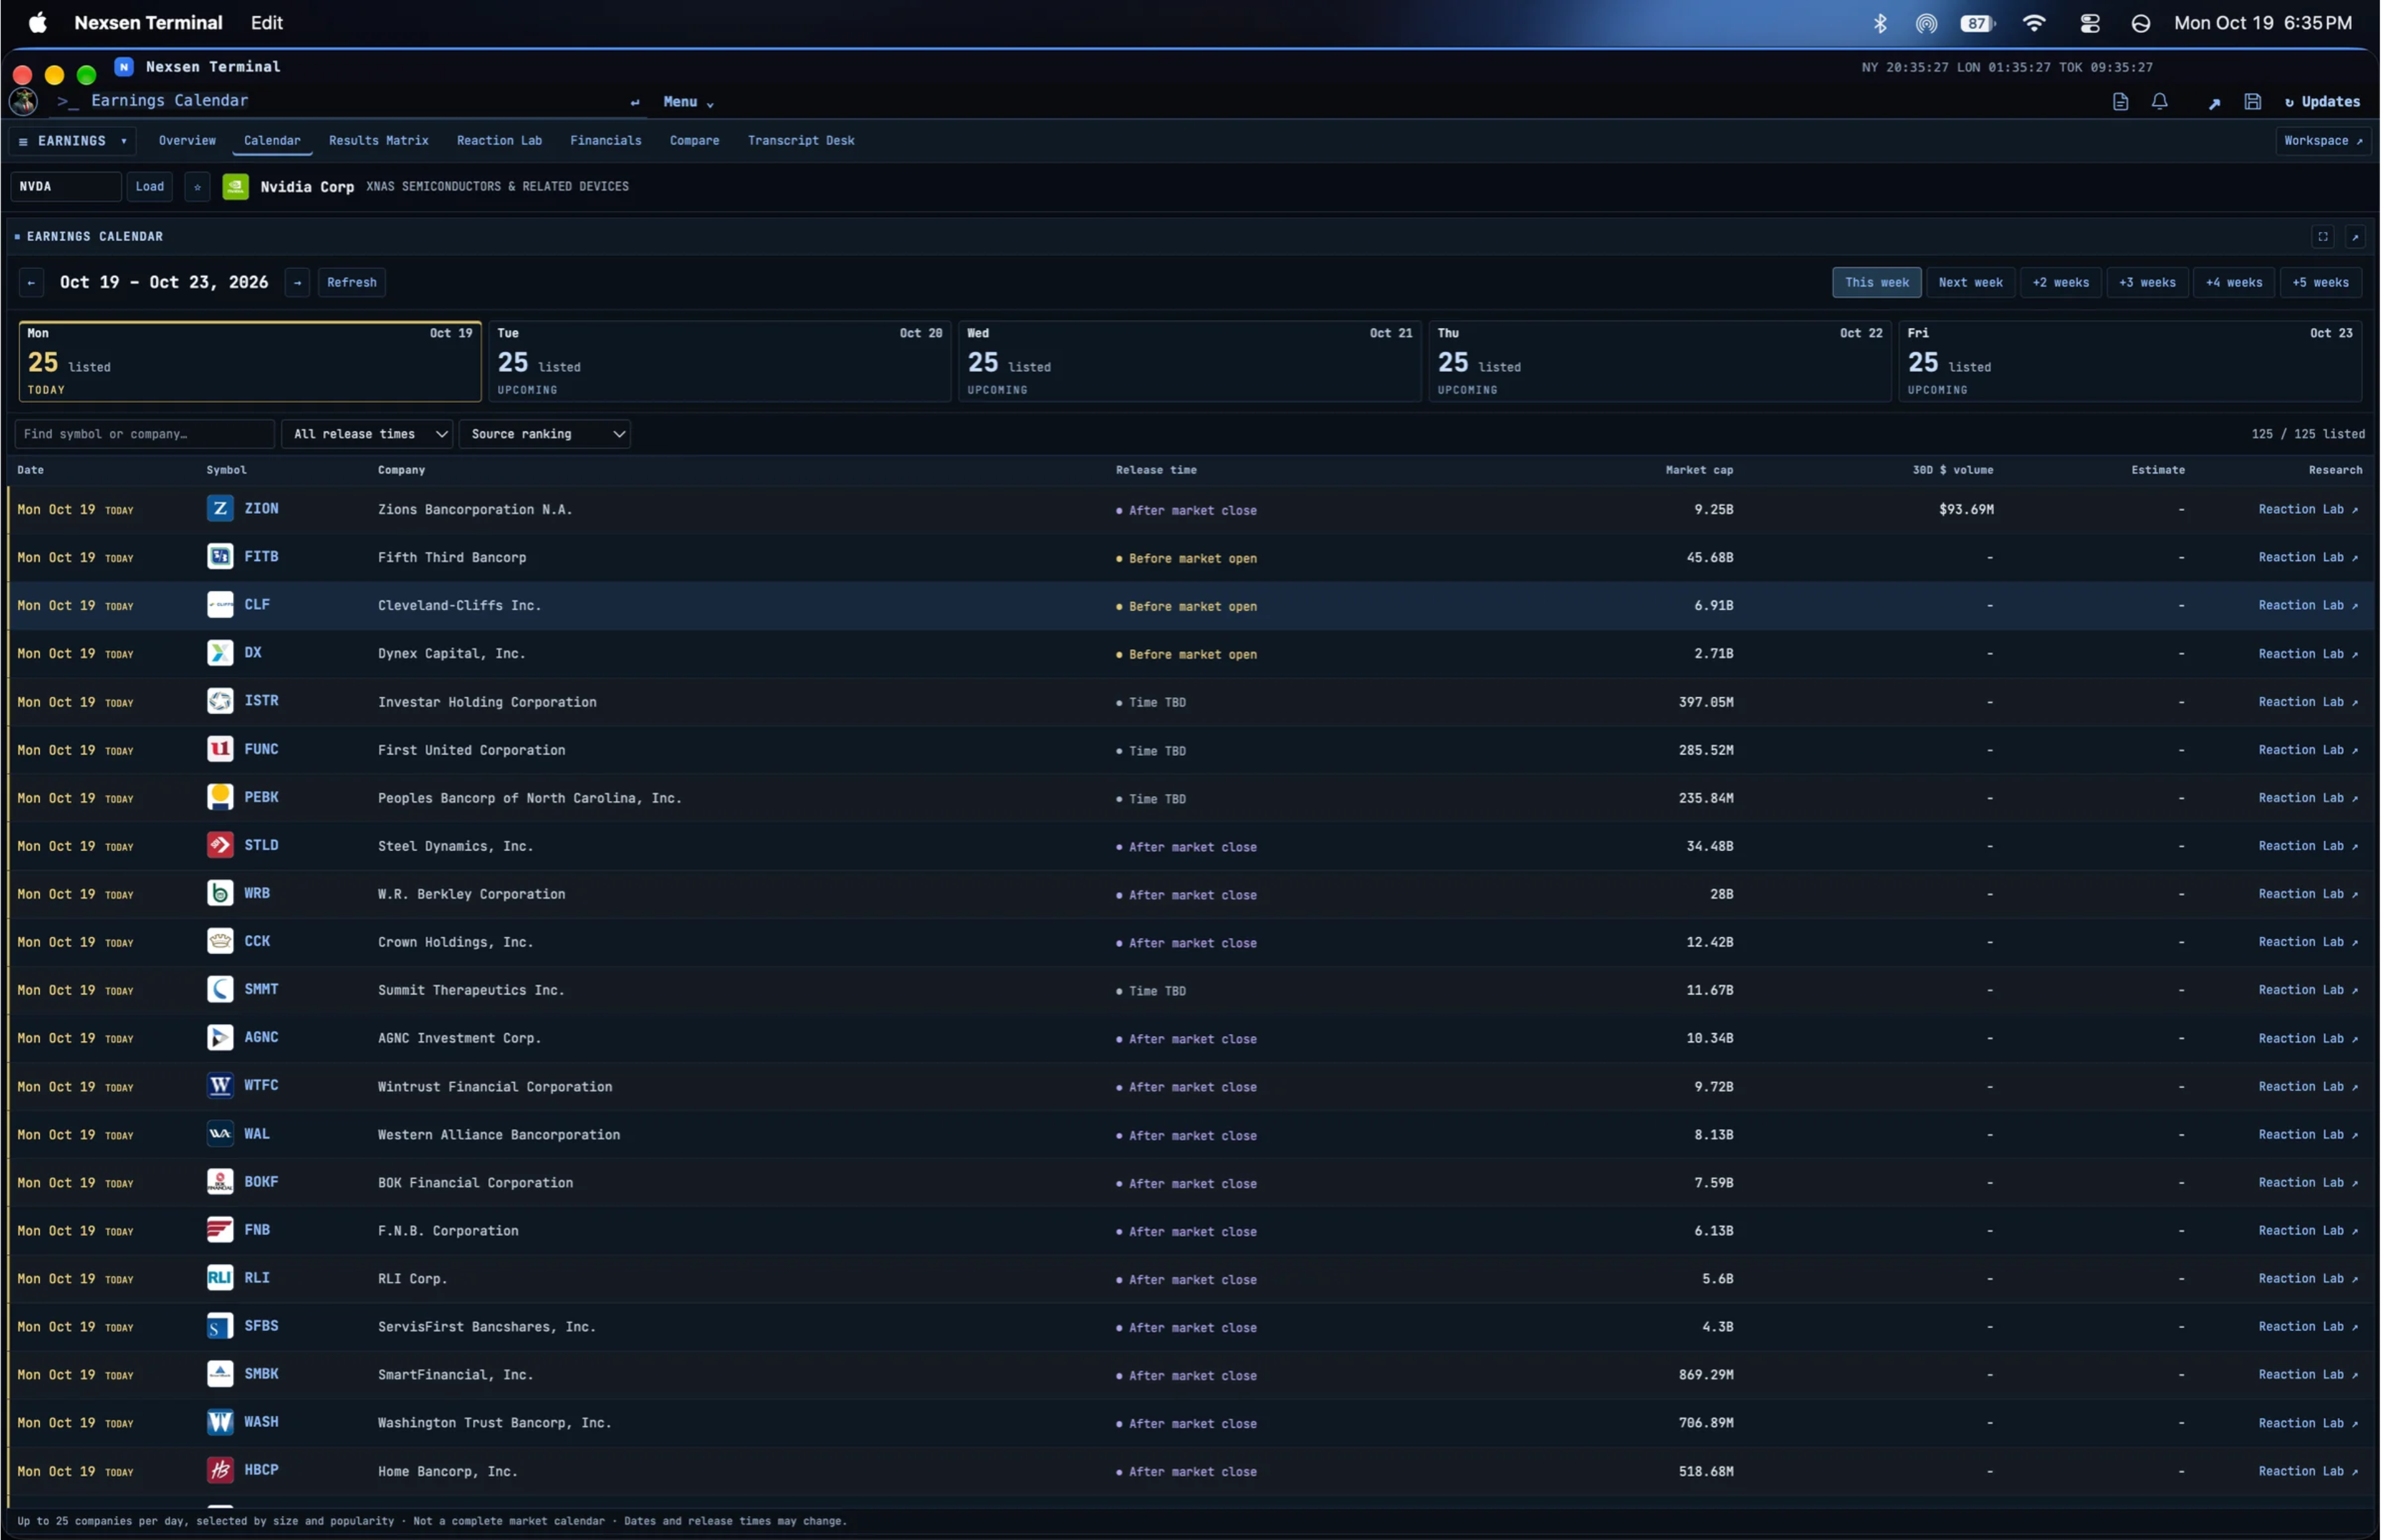
Know what is coming into view.
Browse upcoming reports and organize your research around company, timing and the expectations surrounding each release.
Compare the report with expectations.
Review earnings outcomes across reporting periods and identify the patterns worth investigating in more detail.
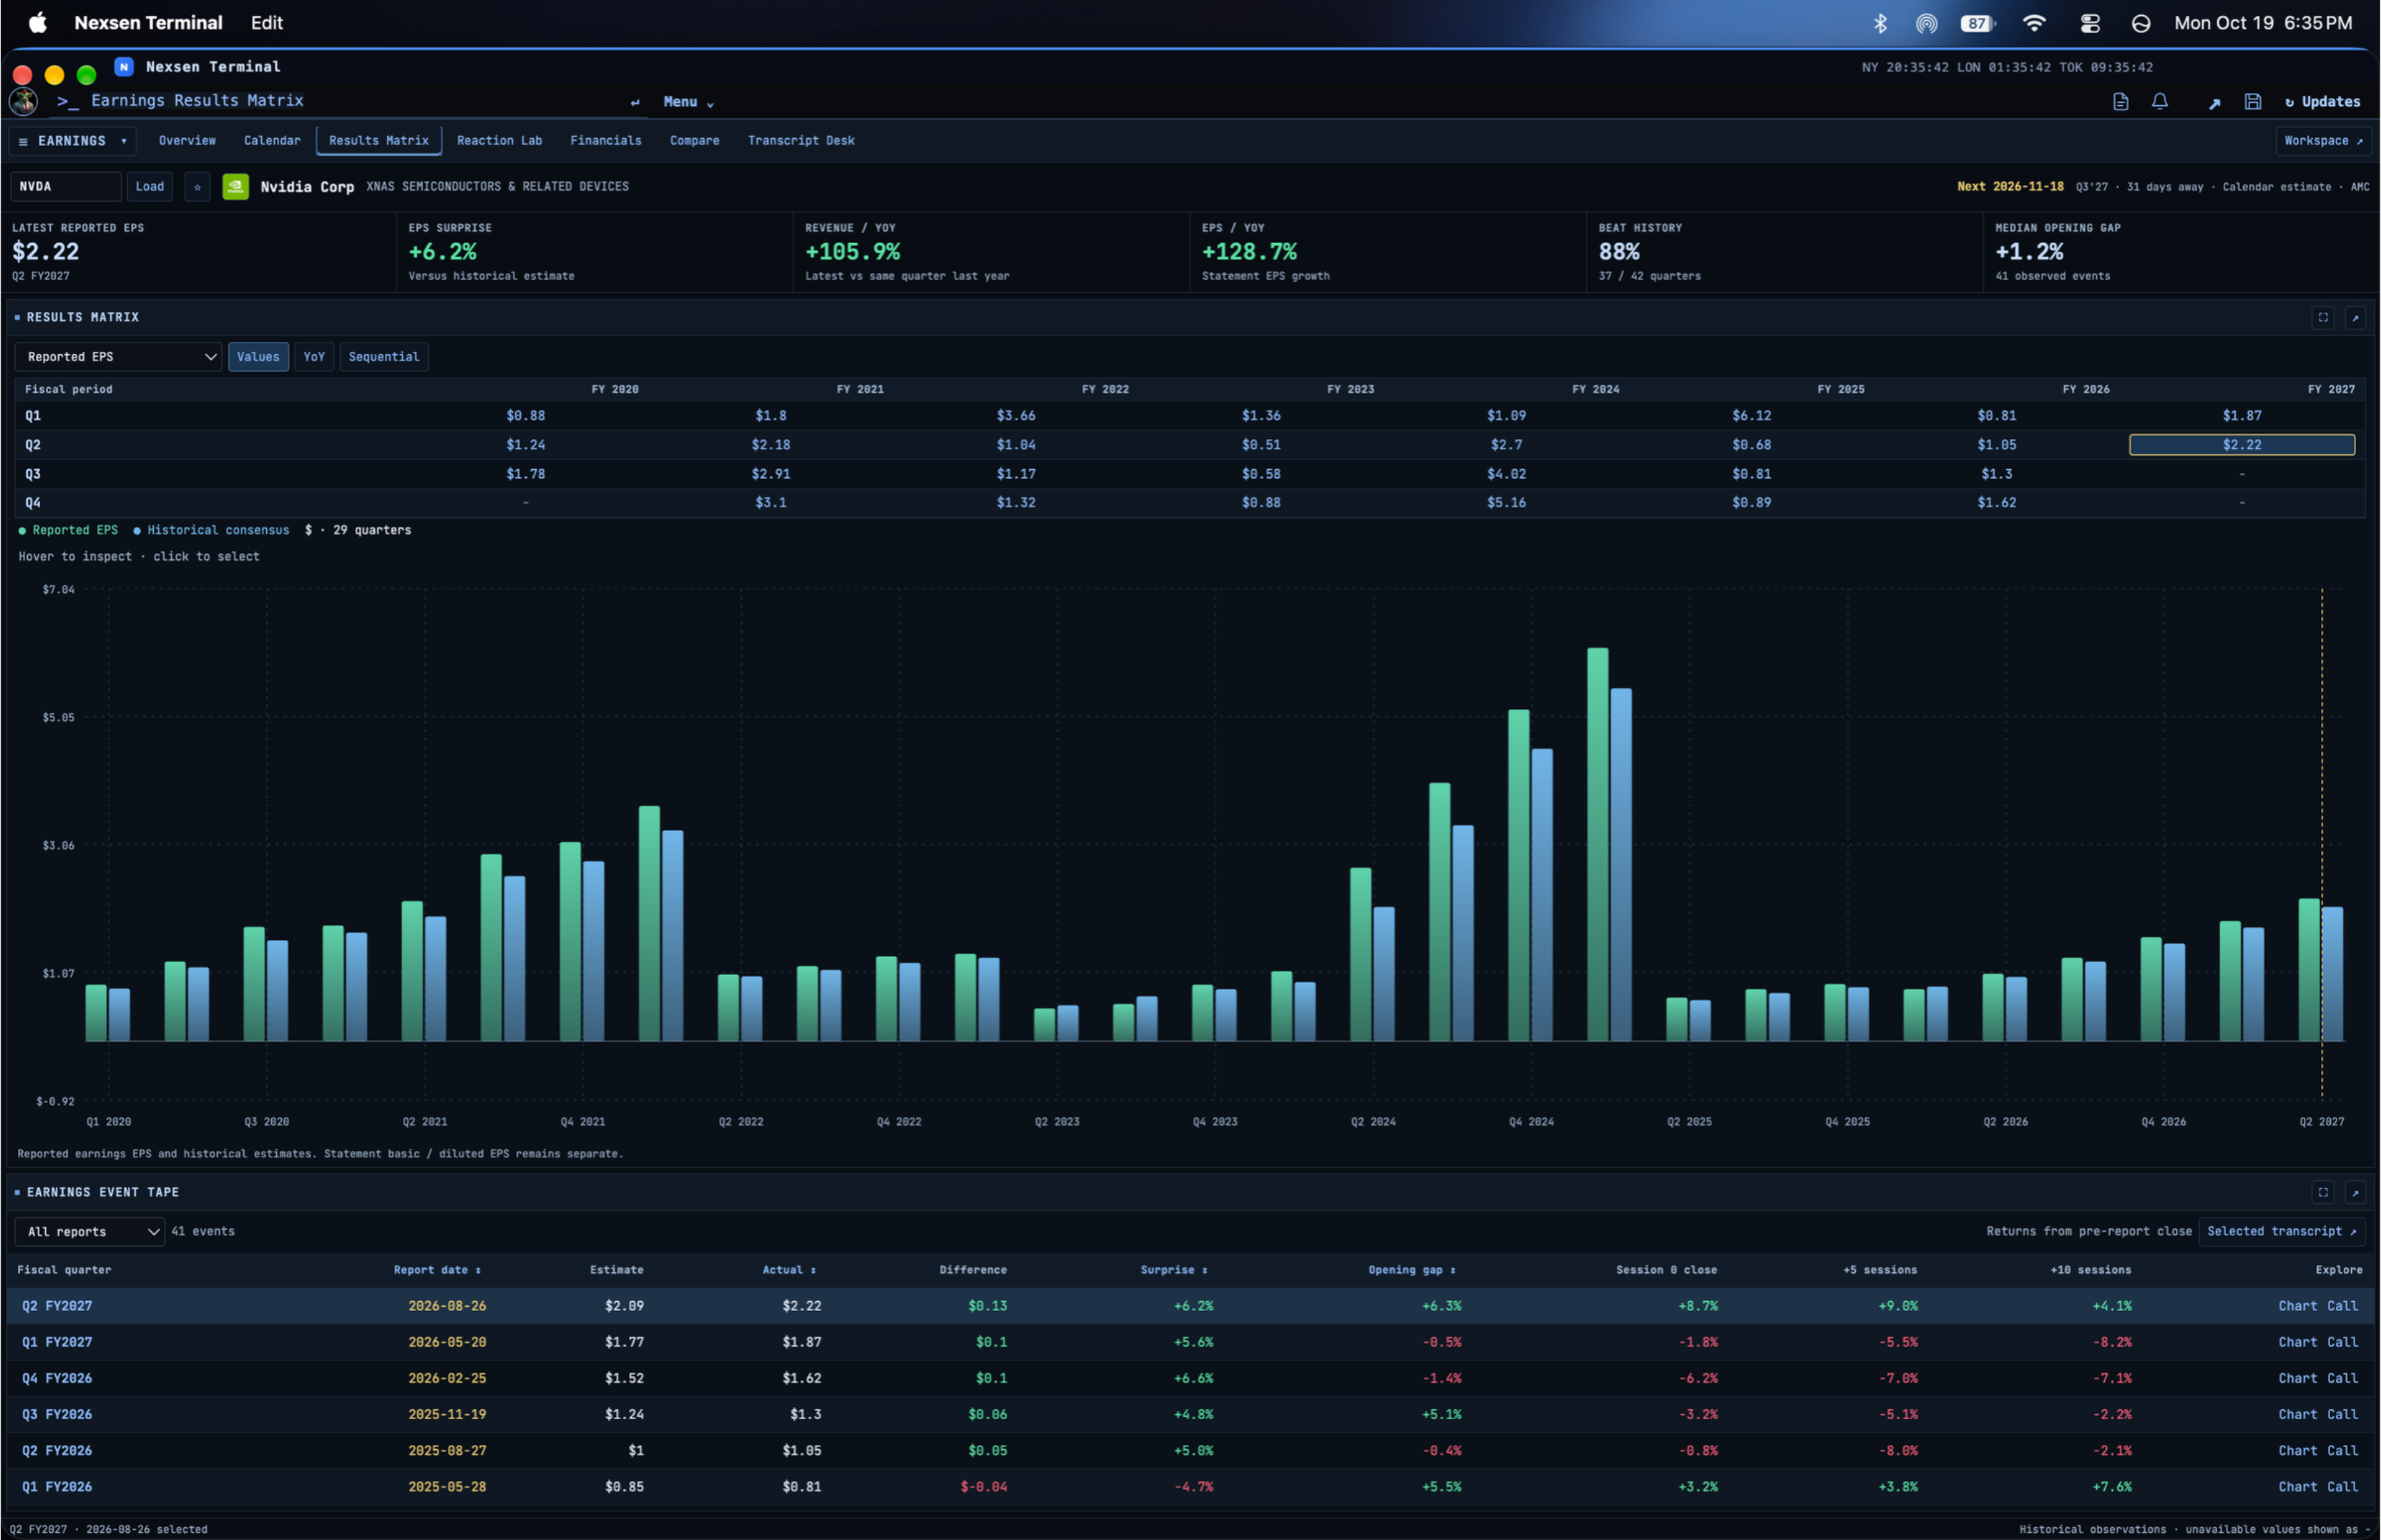
Look beyond the headline result.
Explore historical price reactions around earnings to understand how a company has traded through previous reports.
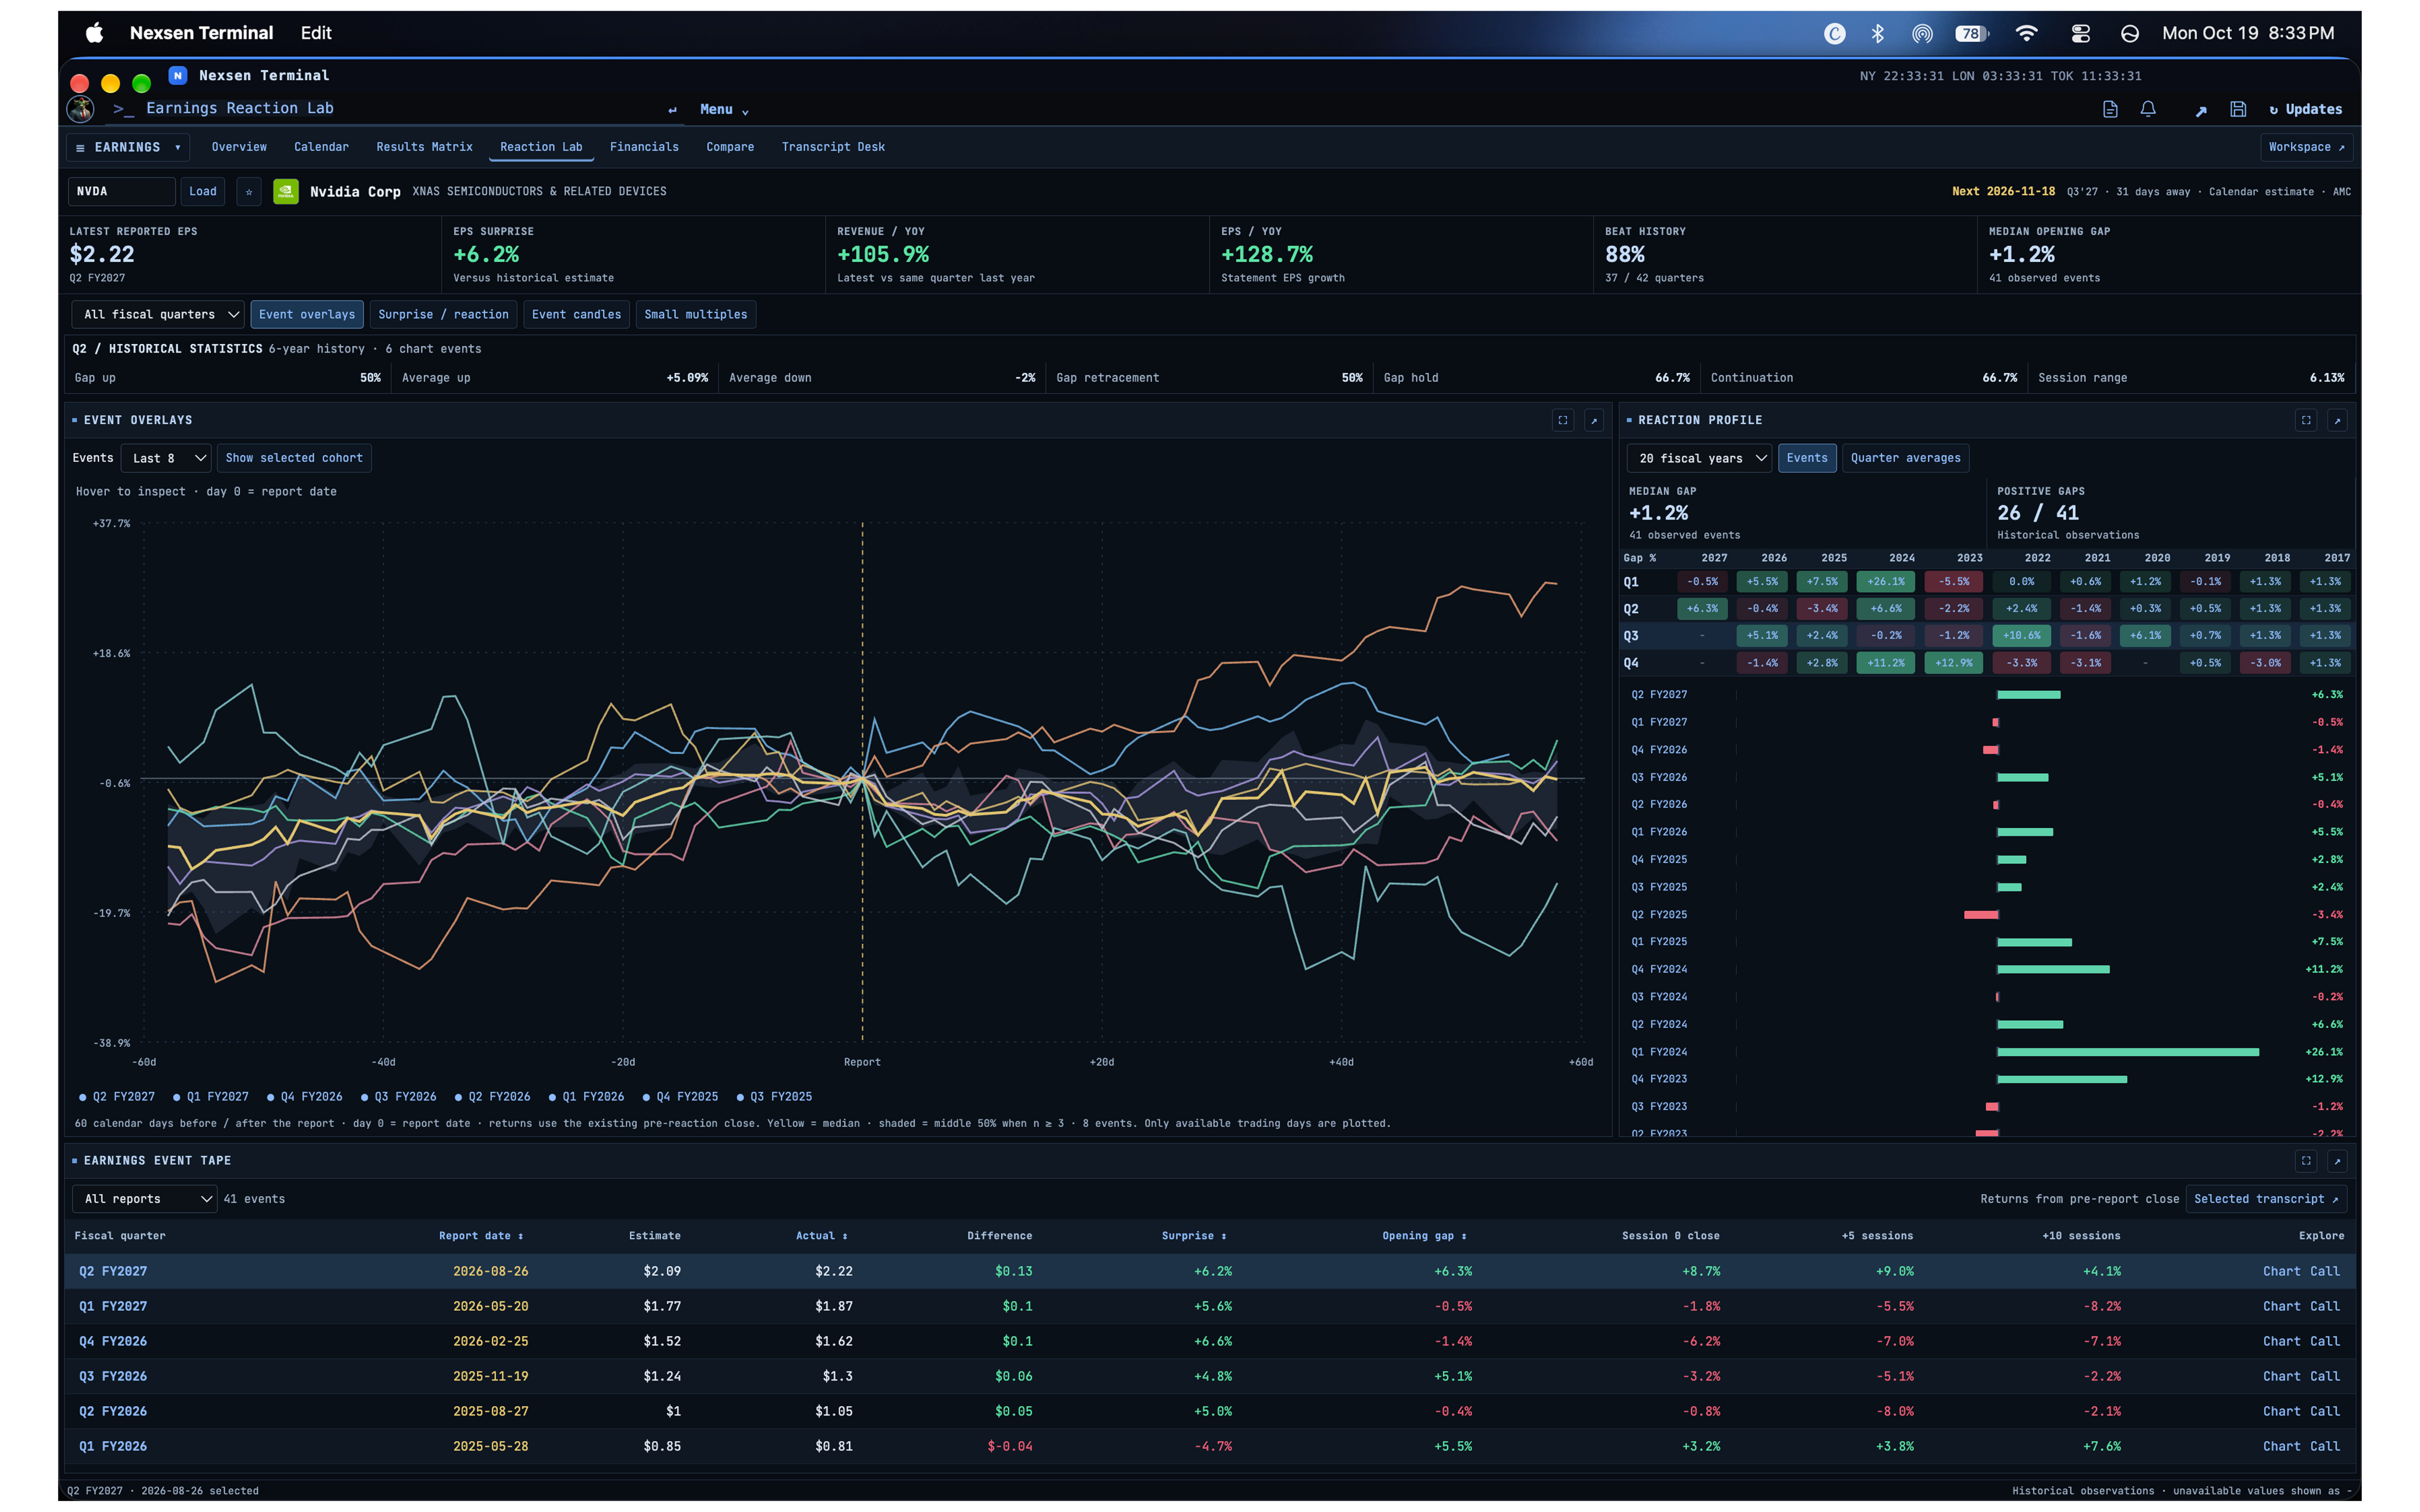
Follow the business beneath the ticker.
Read financial statements and compare reporting periods to investigate growth, profitability and changes in the company’s financial position.
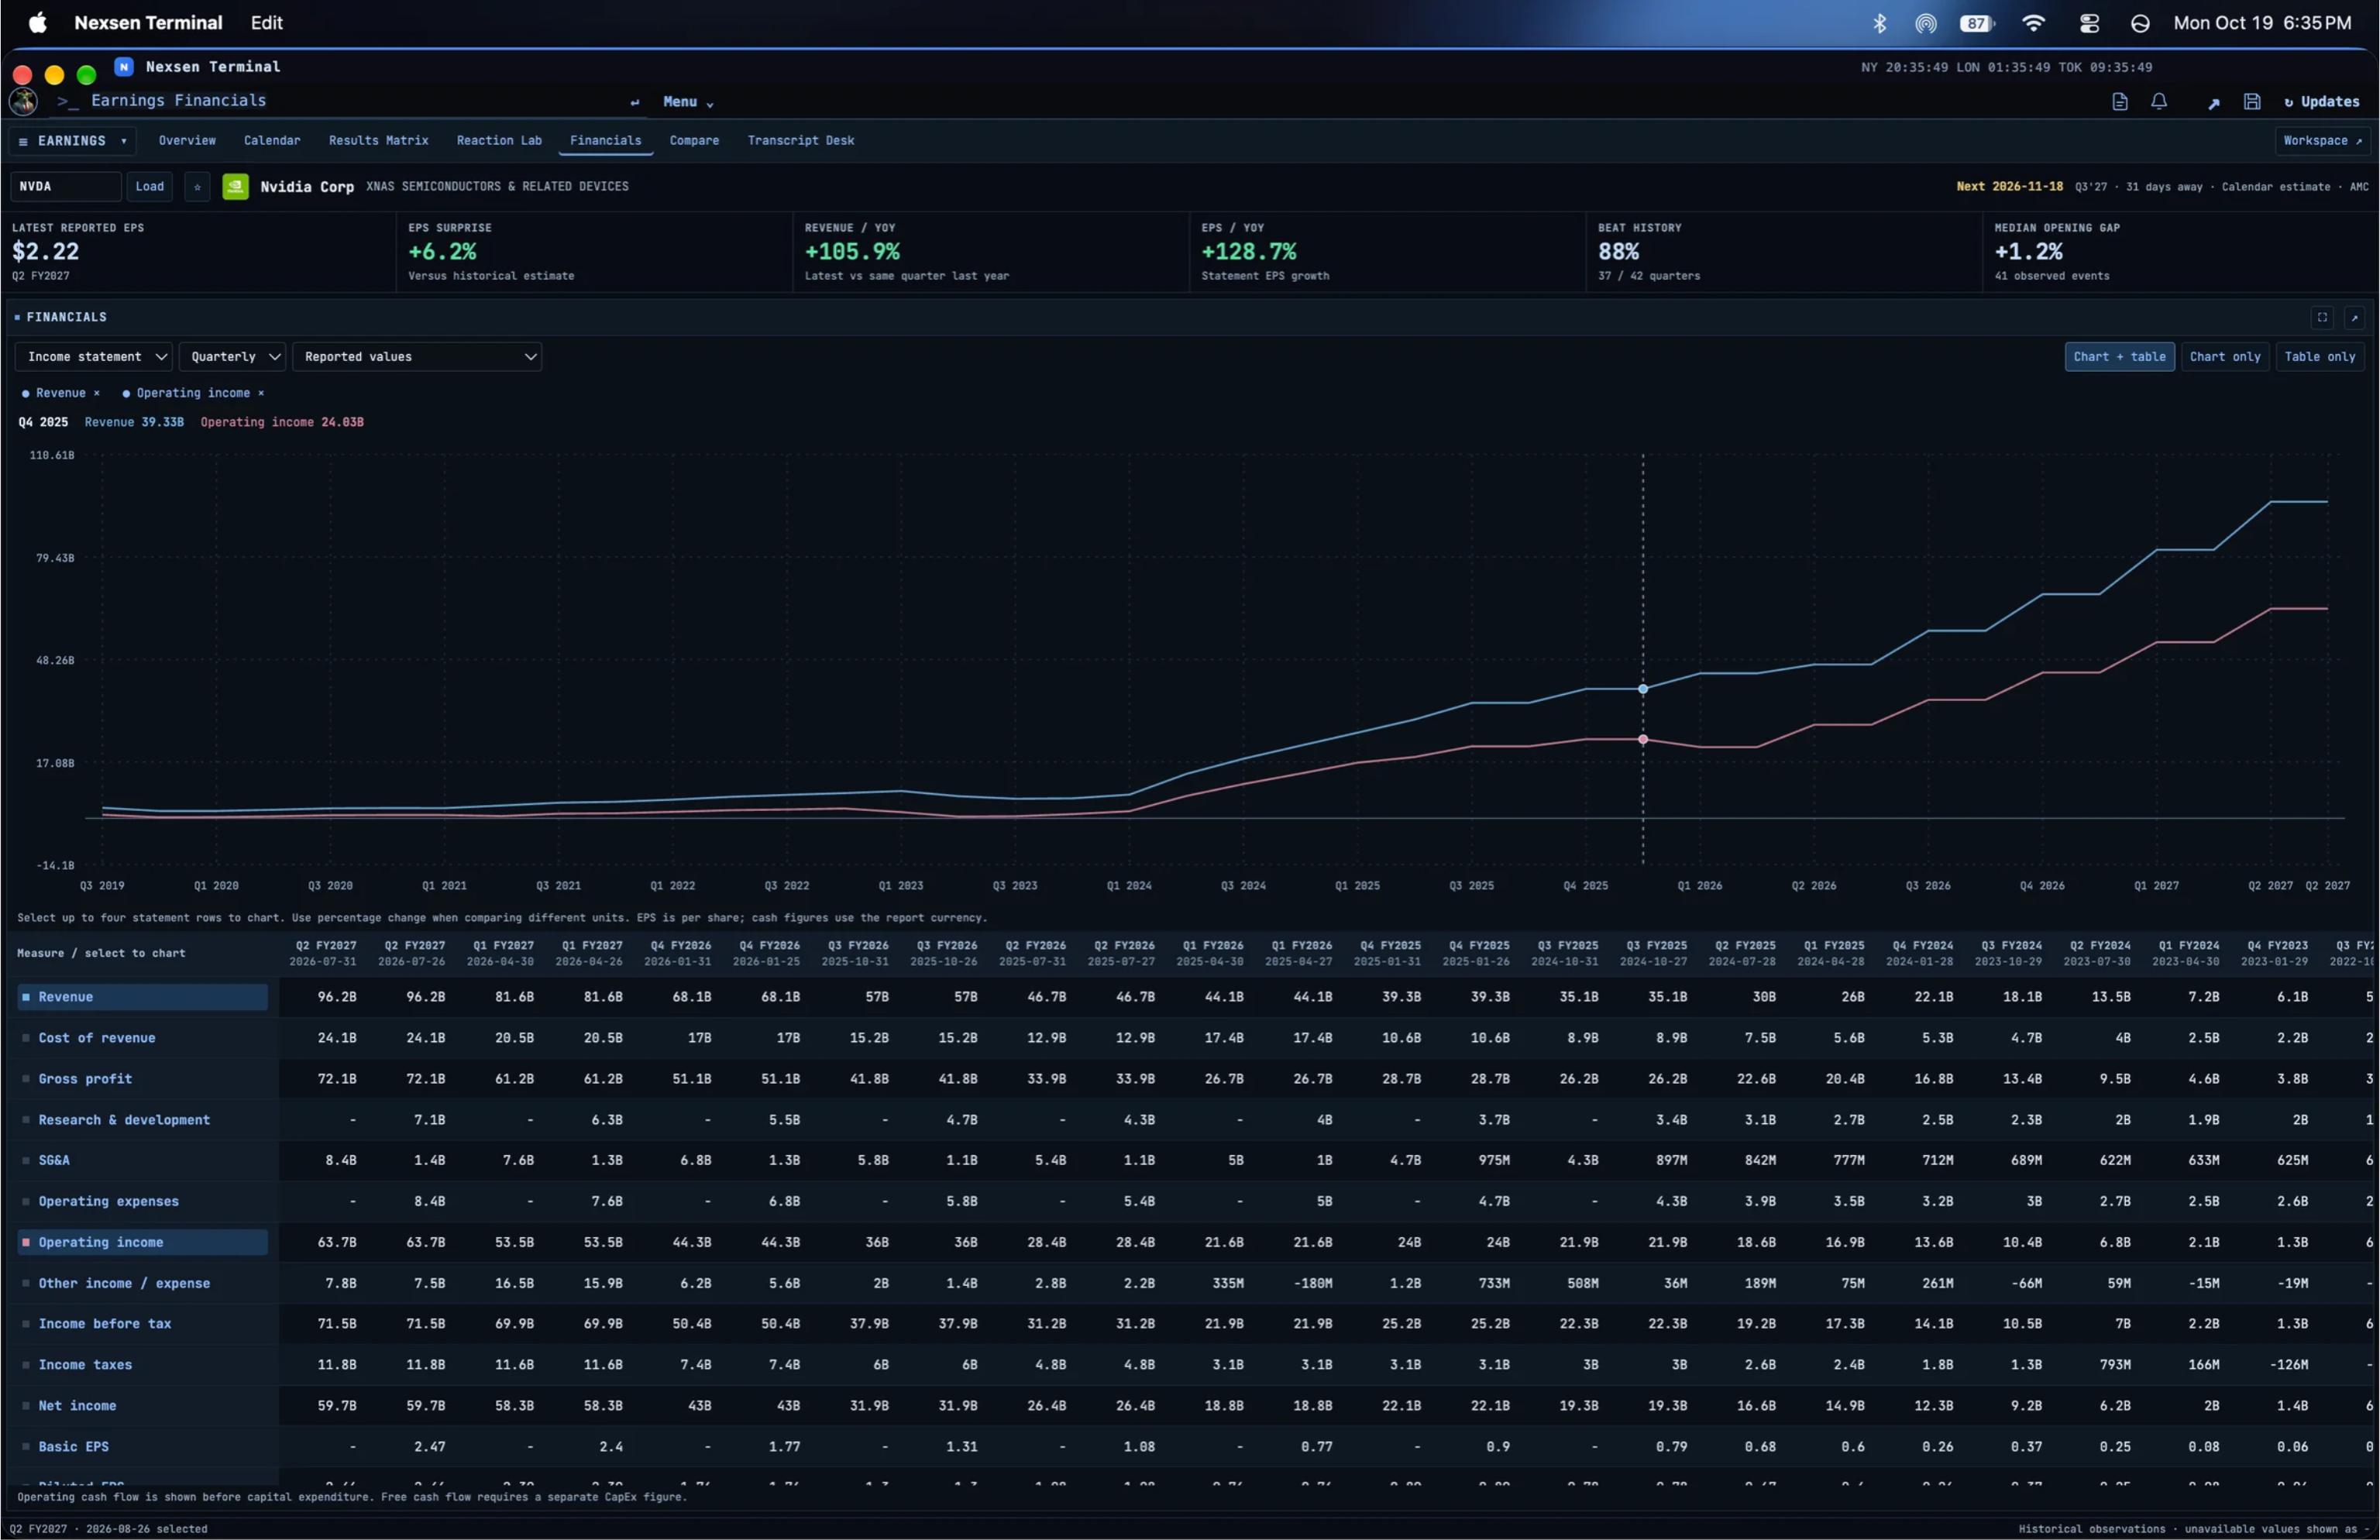
Make the comparison side by side.
Compare companies in the same research view and explore the differences behind their reported performance.
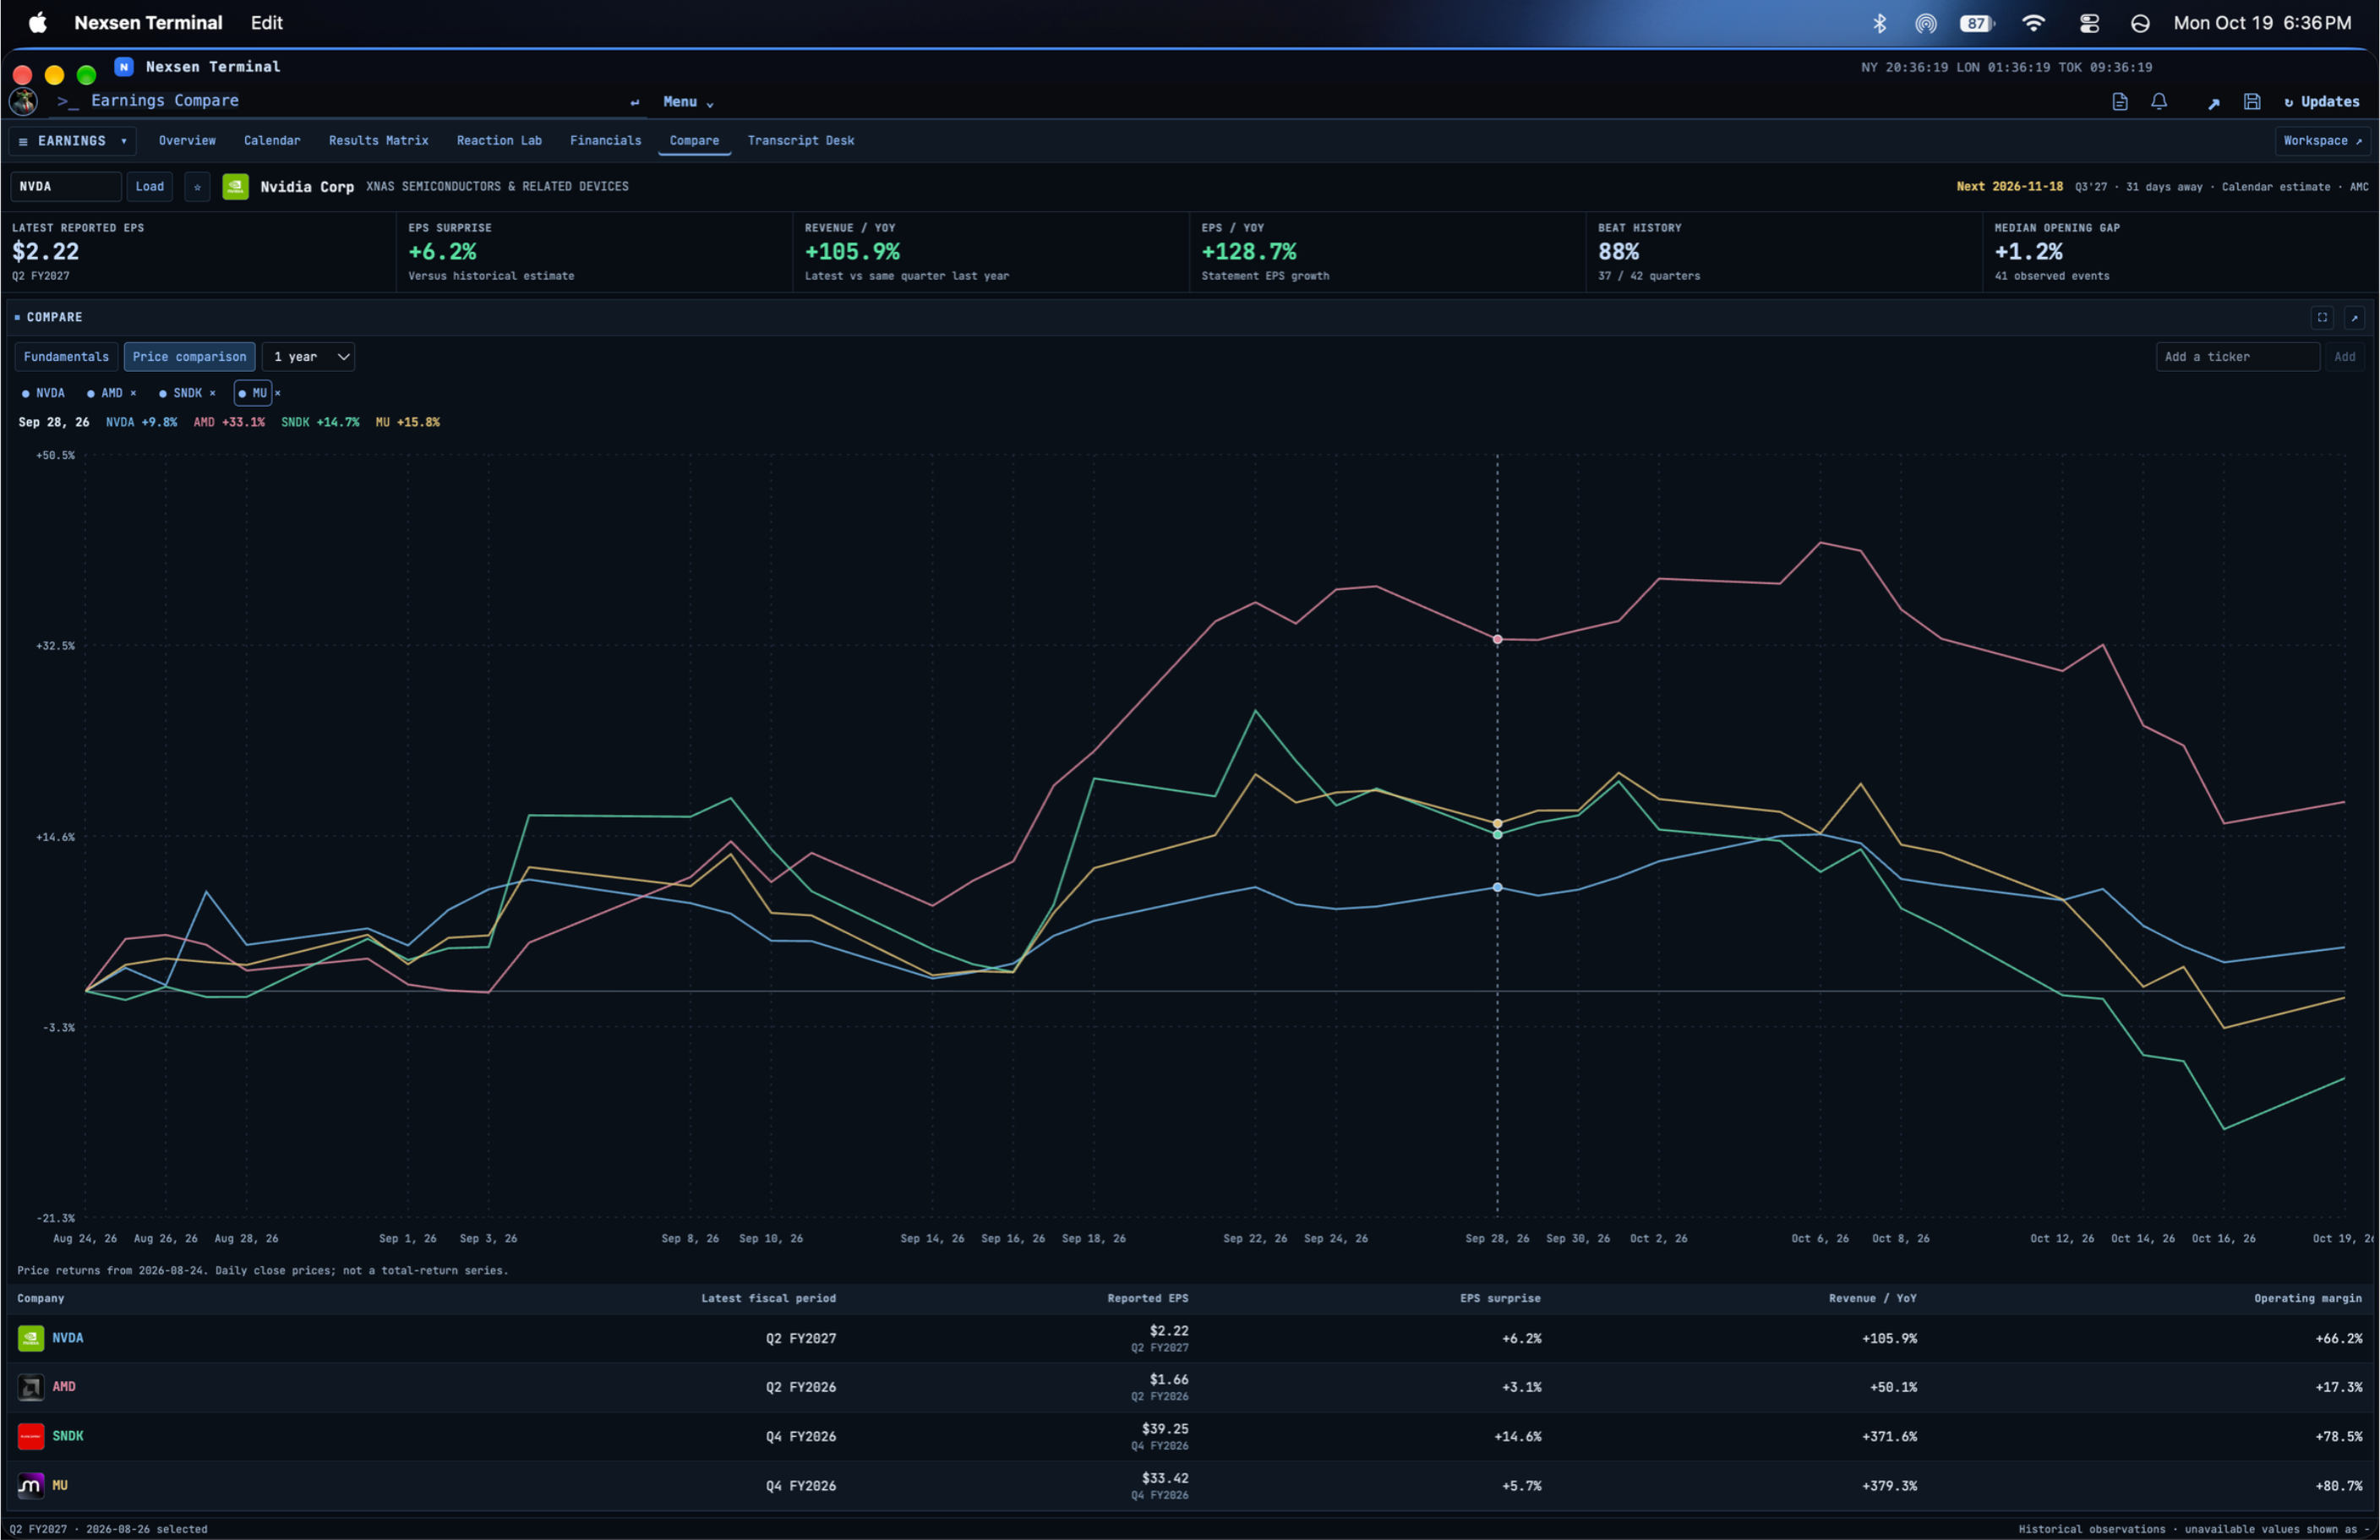
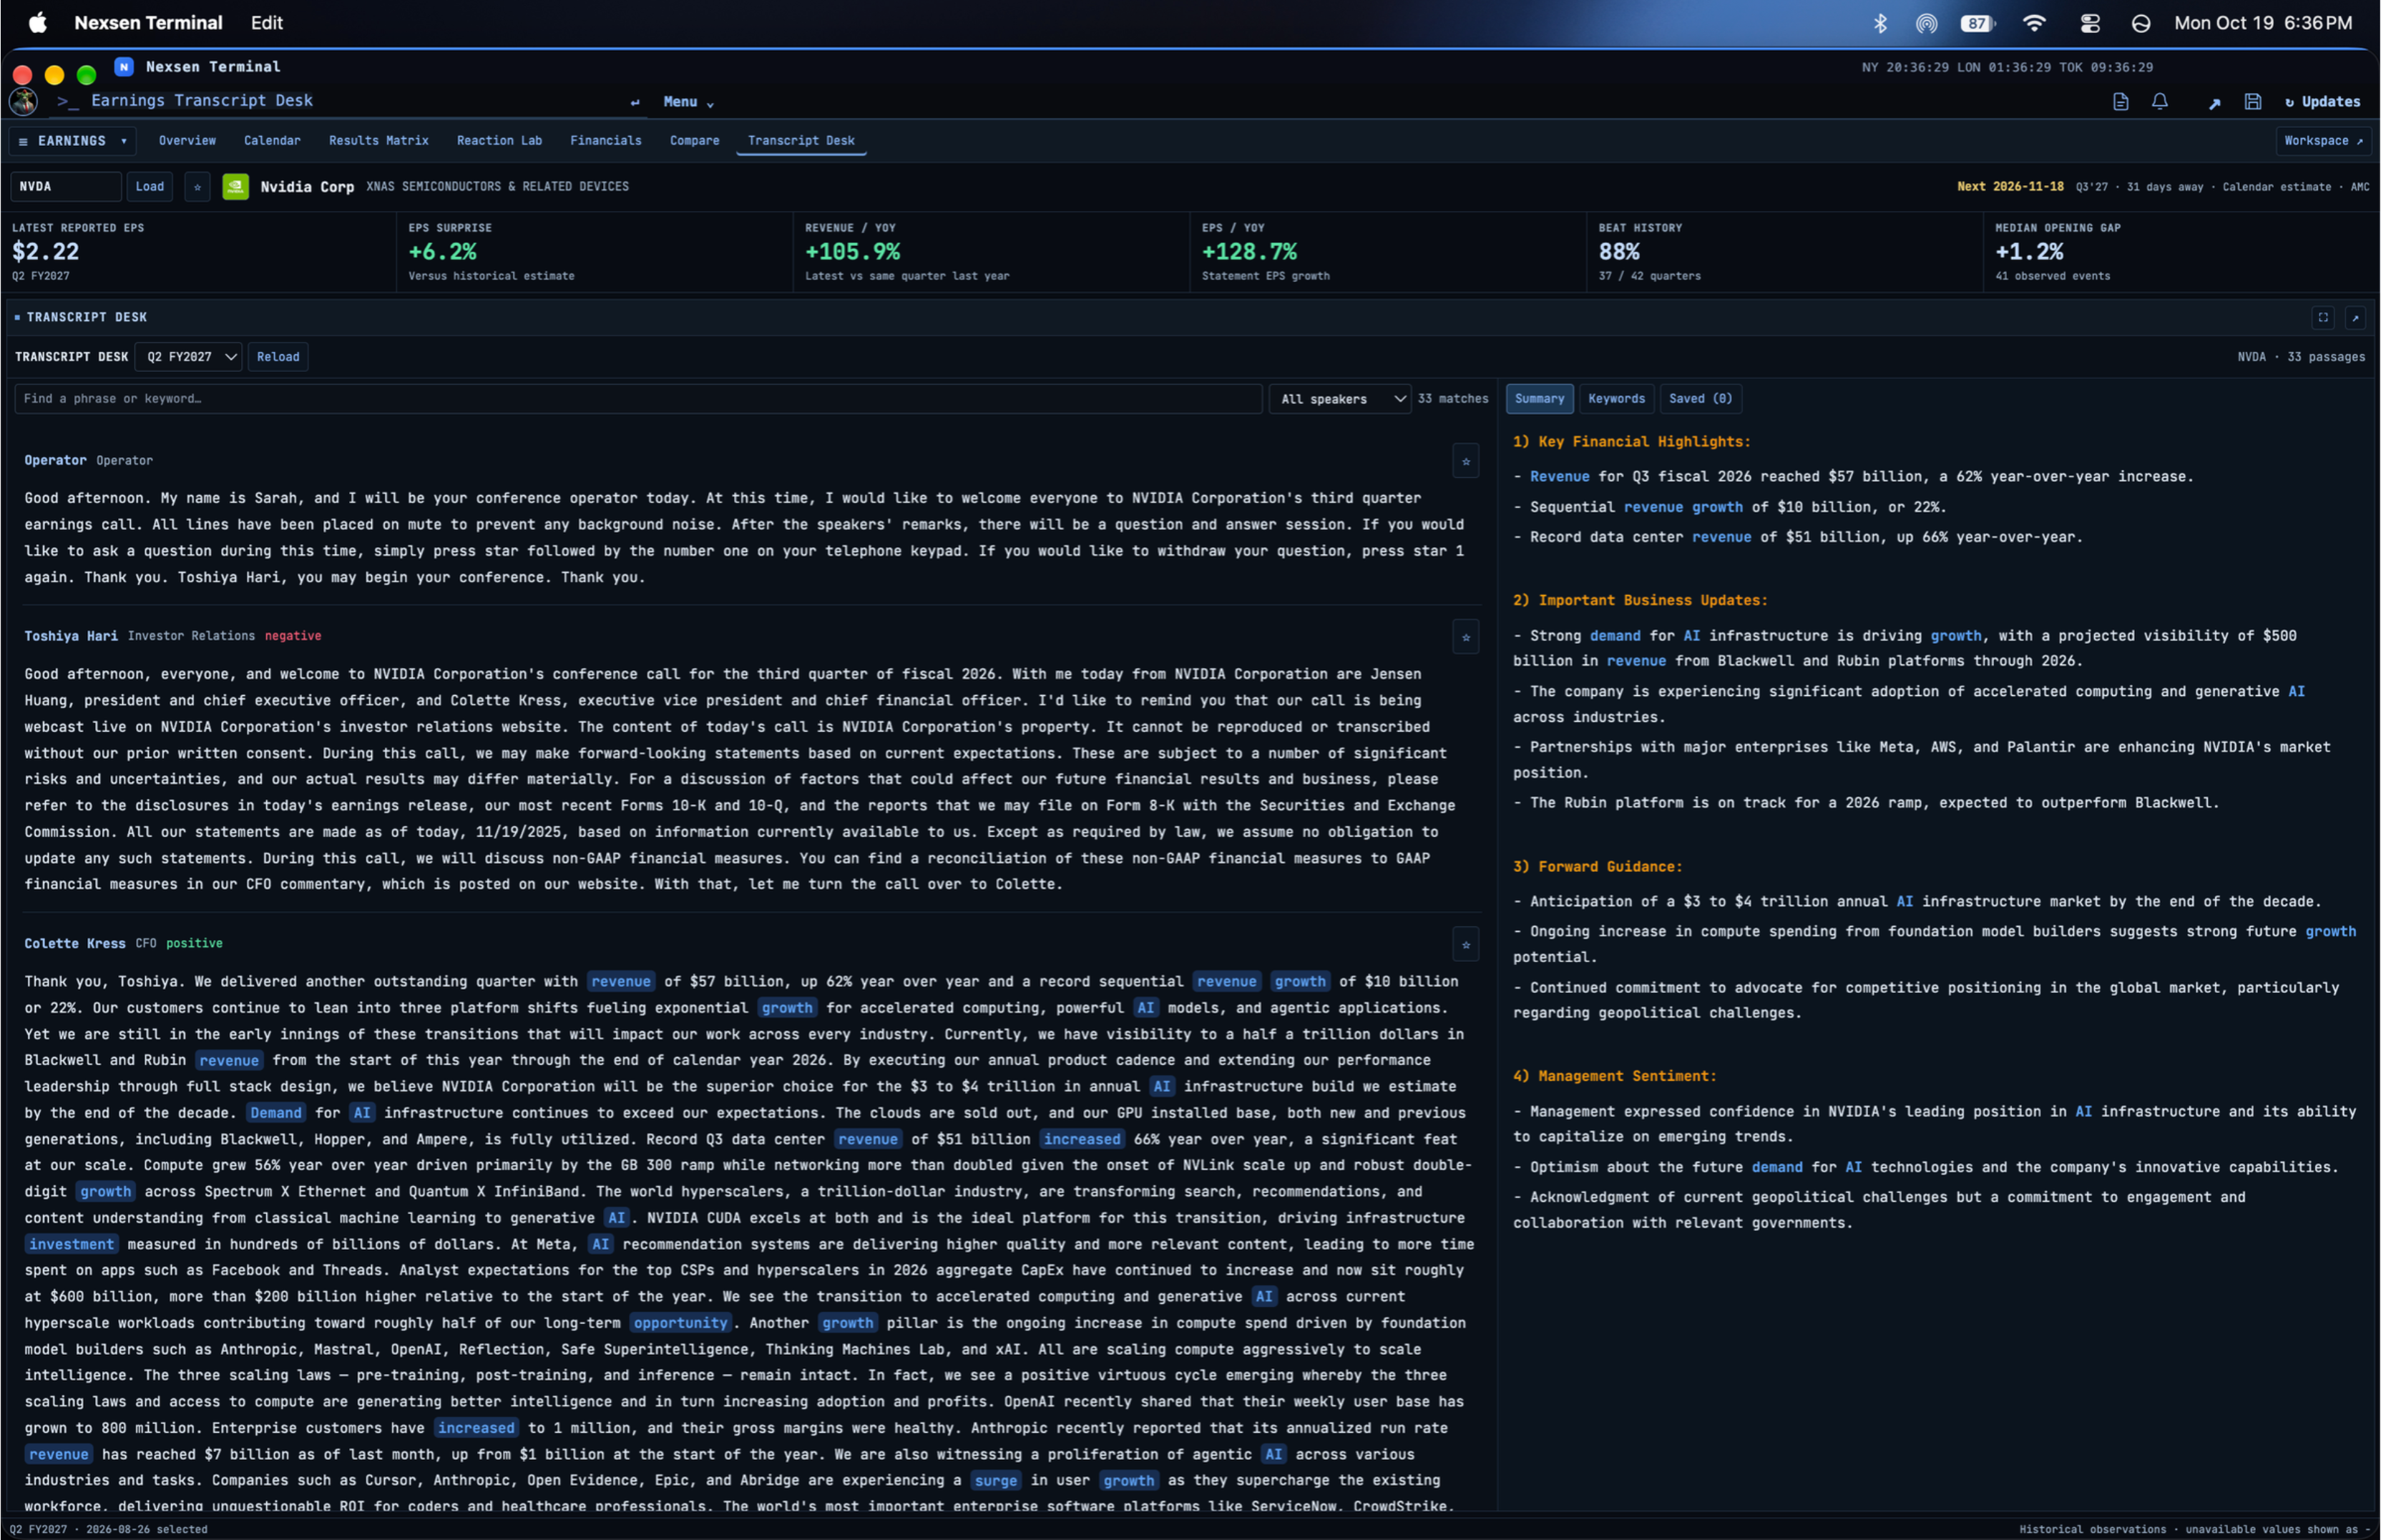
Read what management actually said.
Explore earnings-call transcripts and the discussion surrounding a report, keeping the narrative alongside your financial research.
 Back to platform index
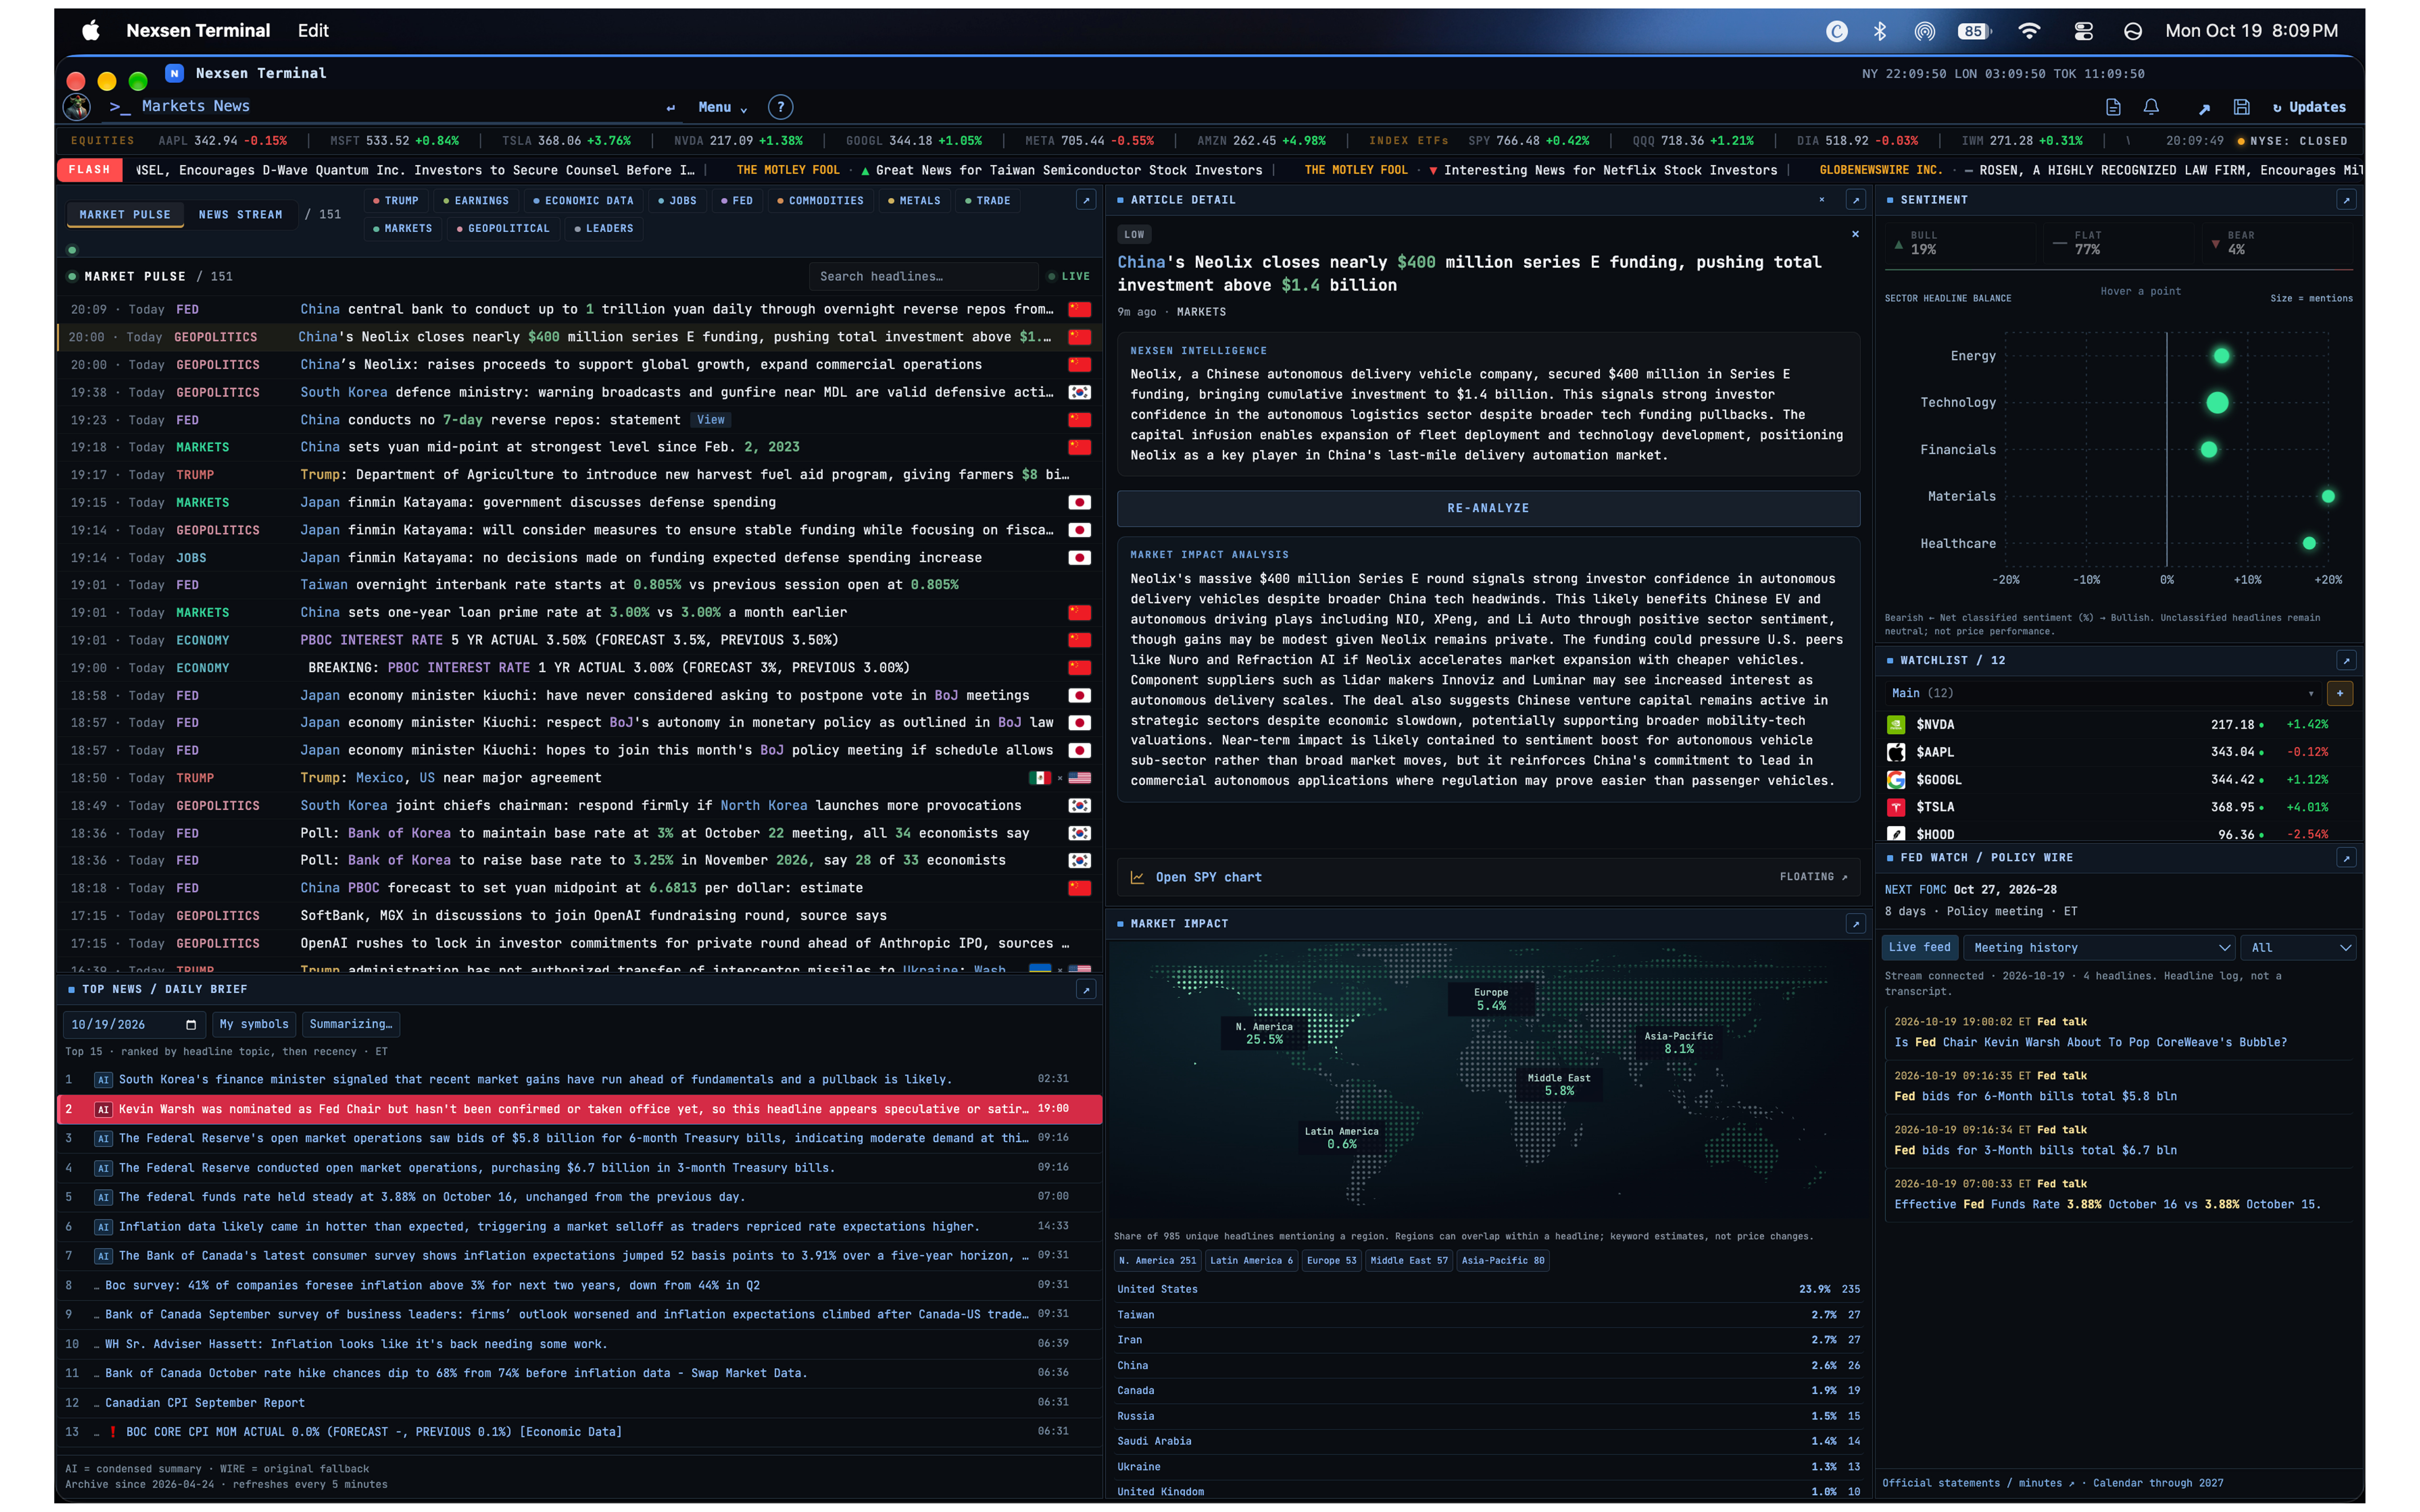
Stay with the story as it develops.
Follow market headlines, summaries and sentiment in one stream, with the company and market context close at hand.
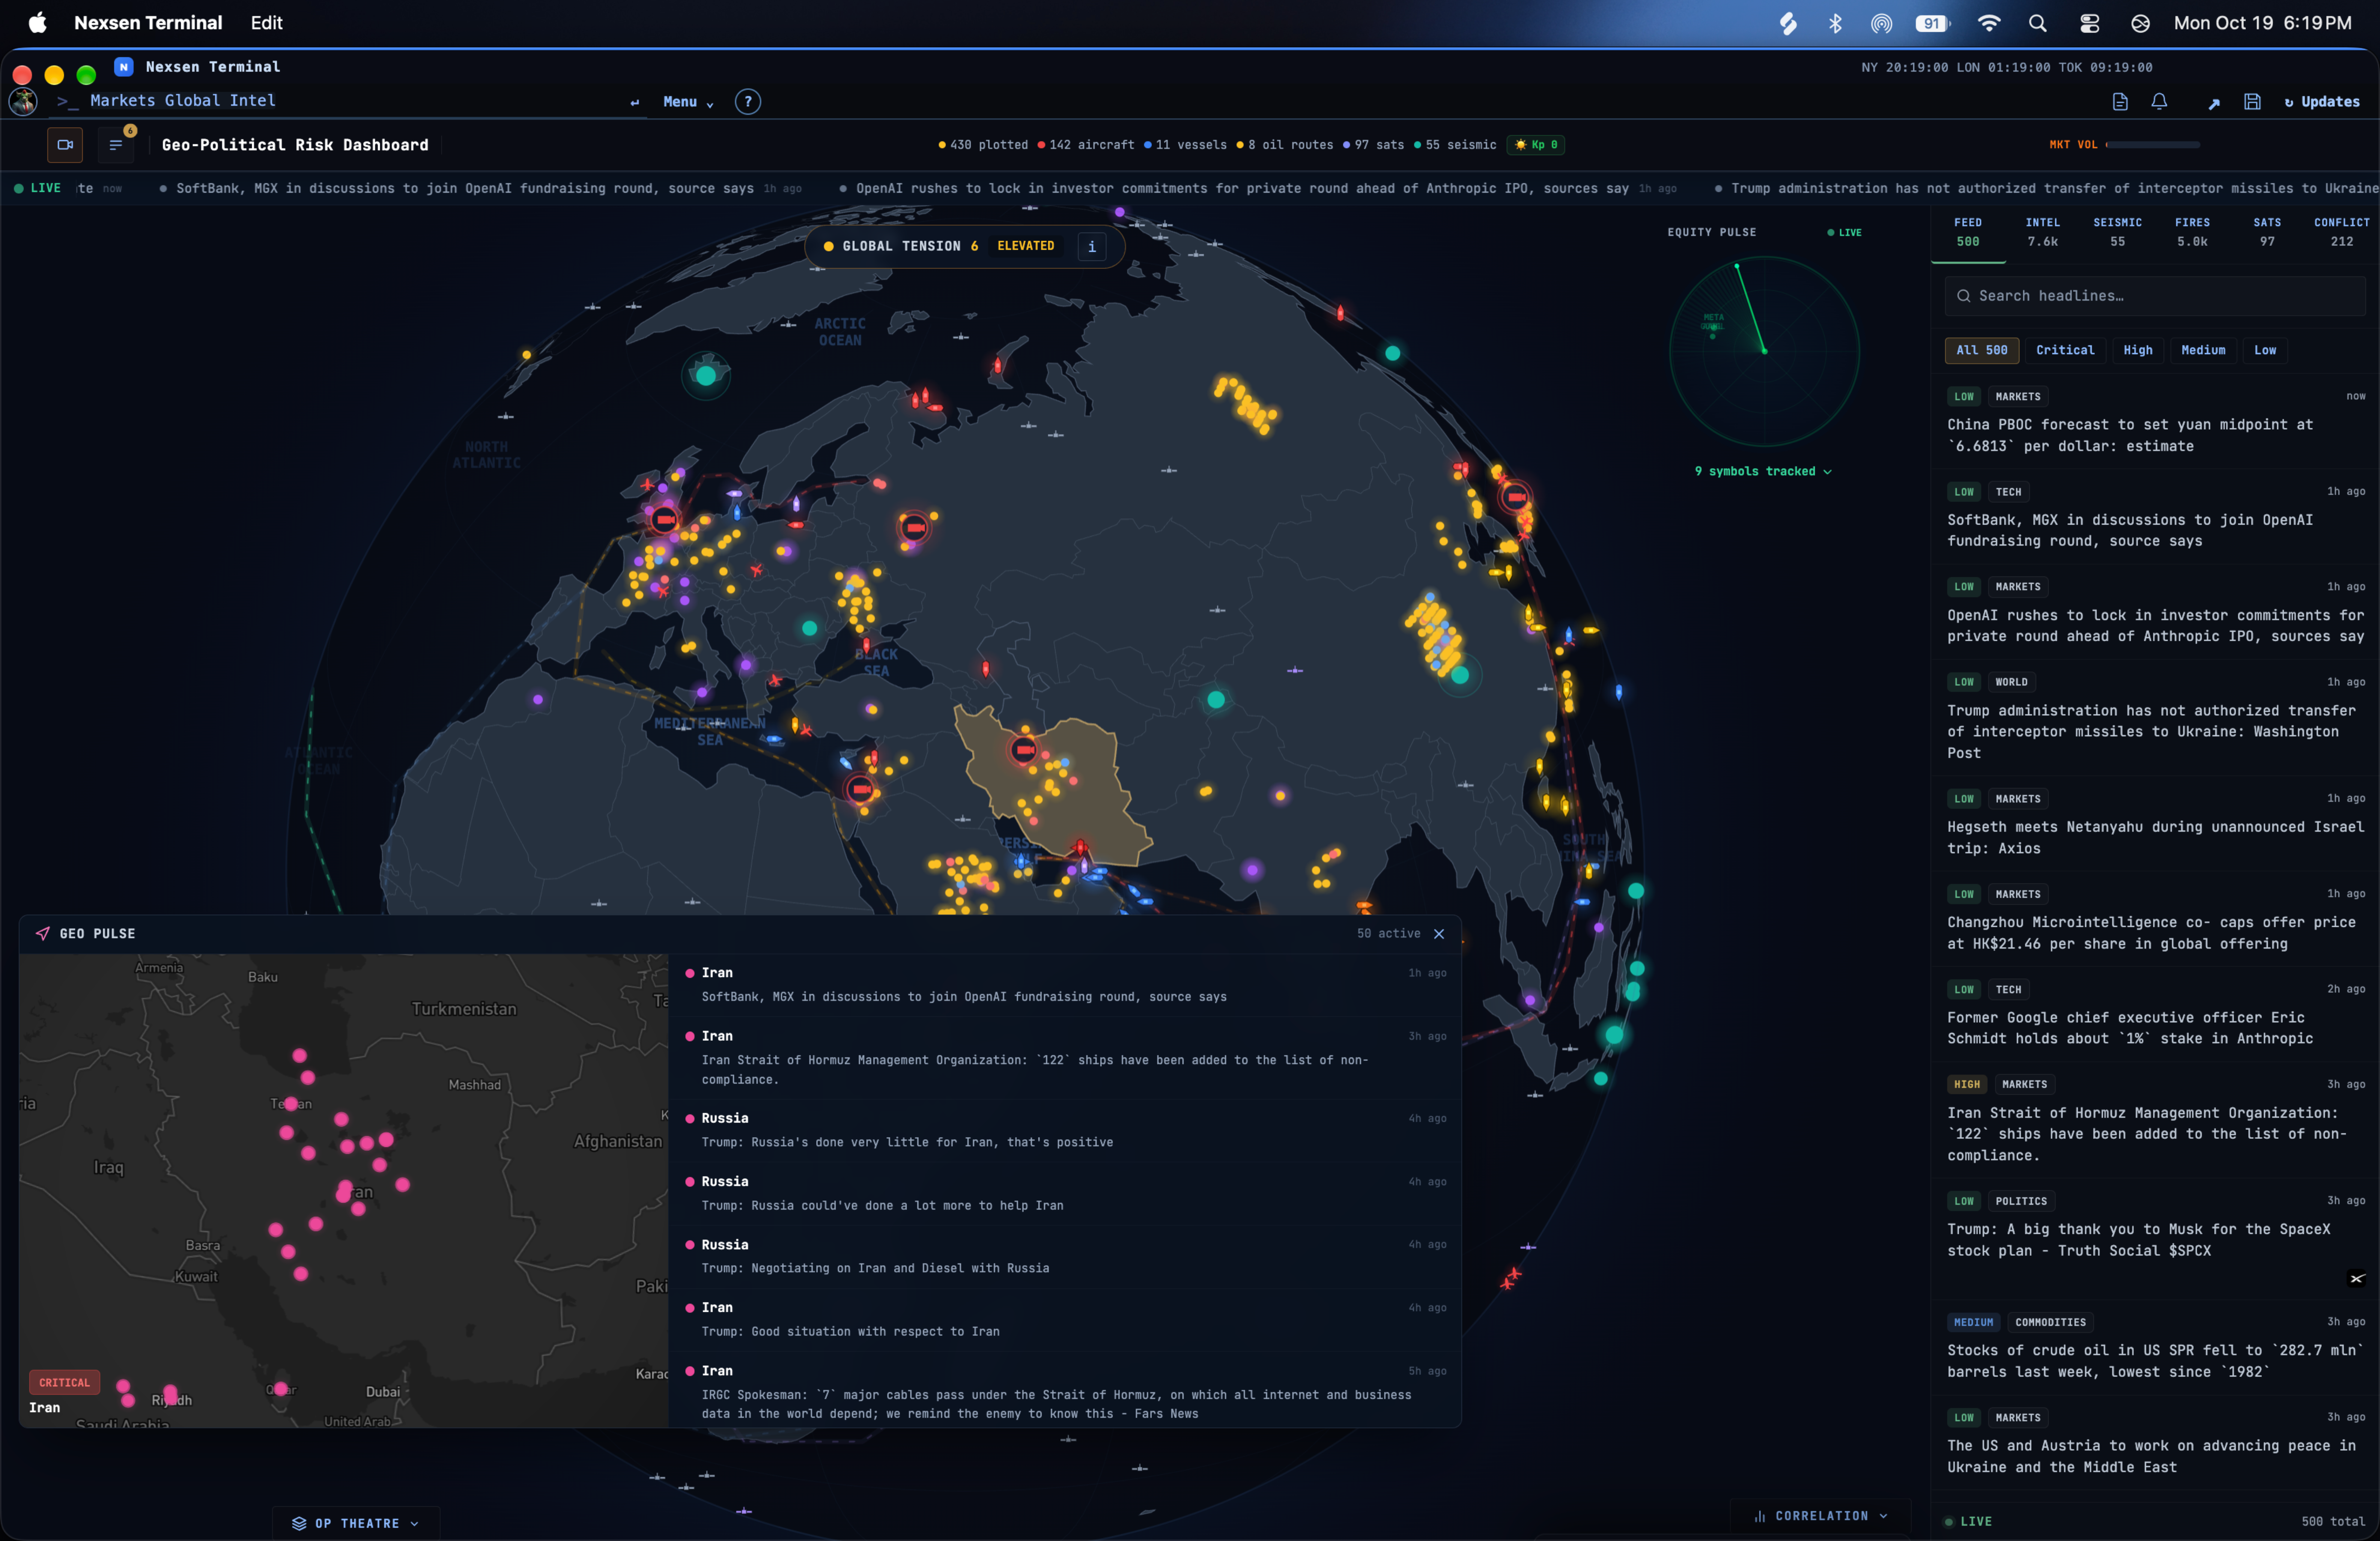
See the market’s global backdrop.
Explore events geographically and investigate the connections between global developments and the markets you follow.
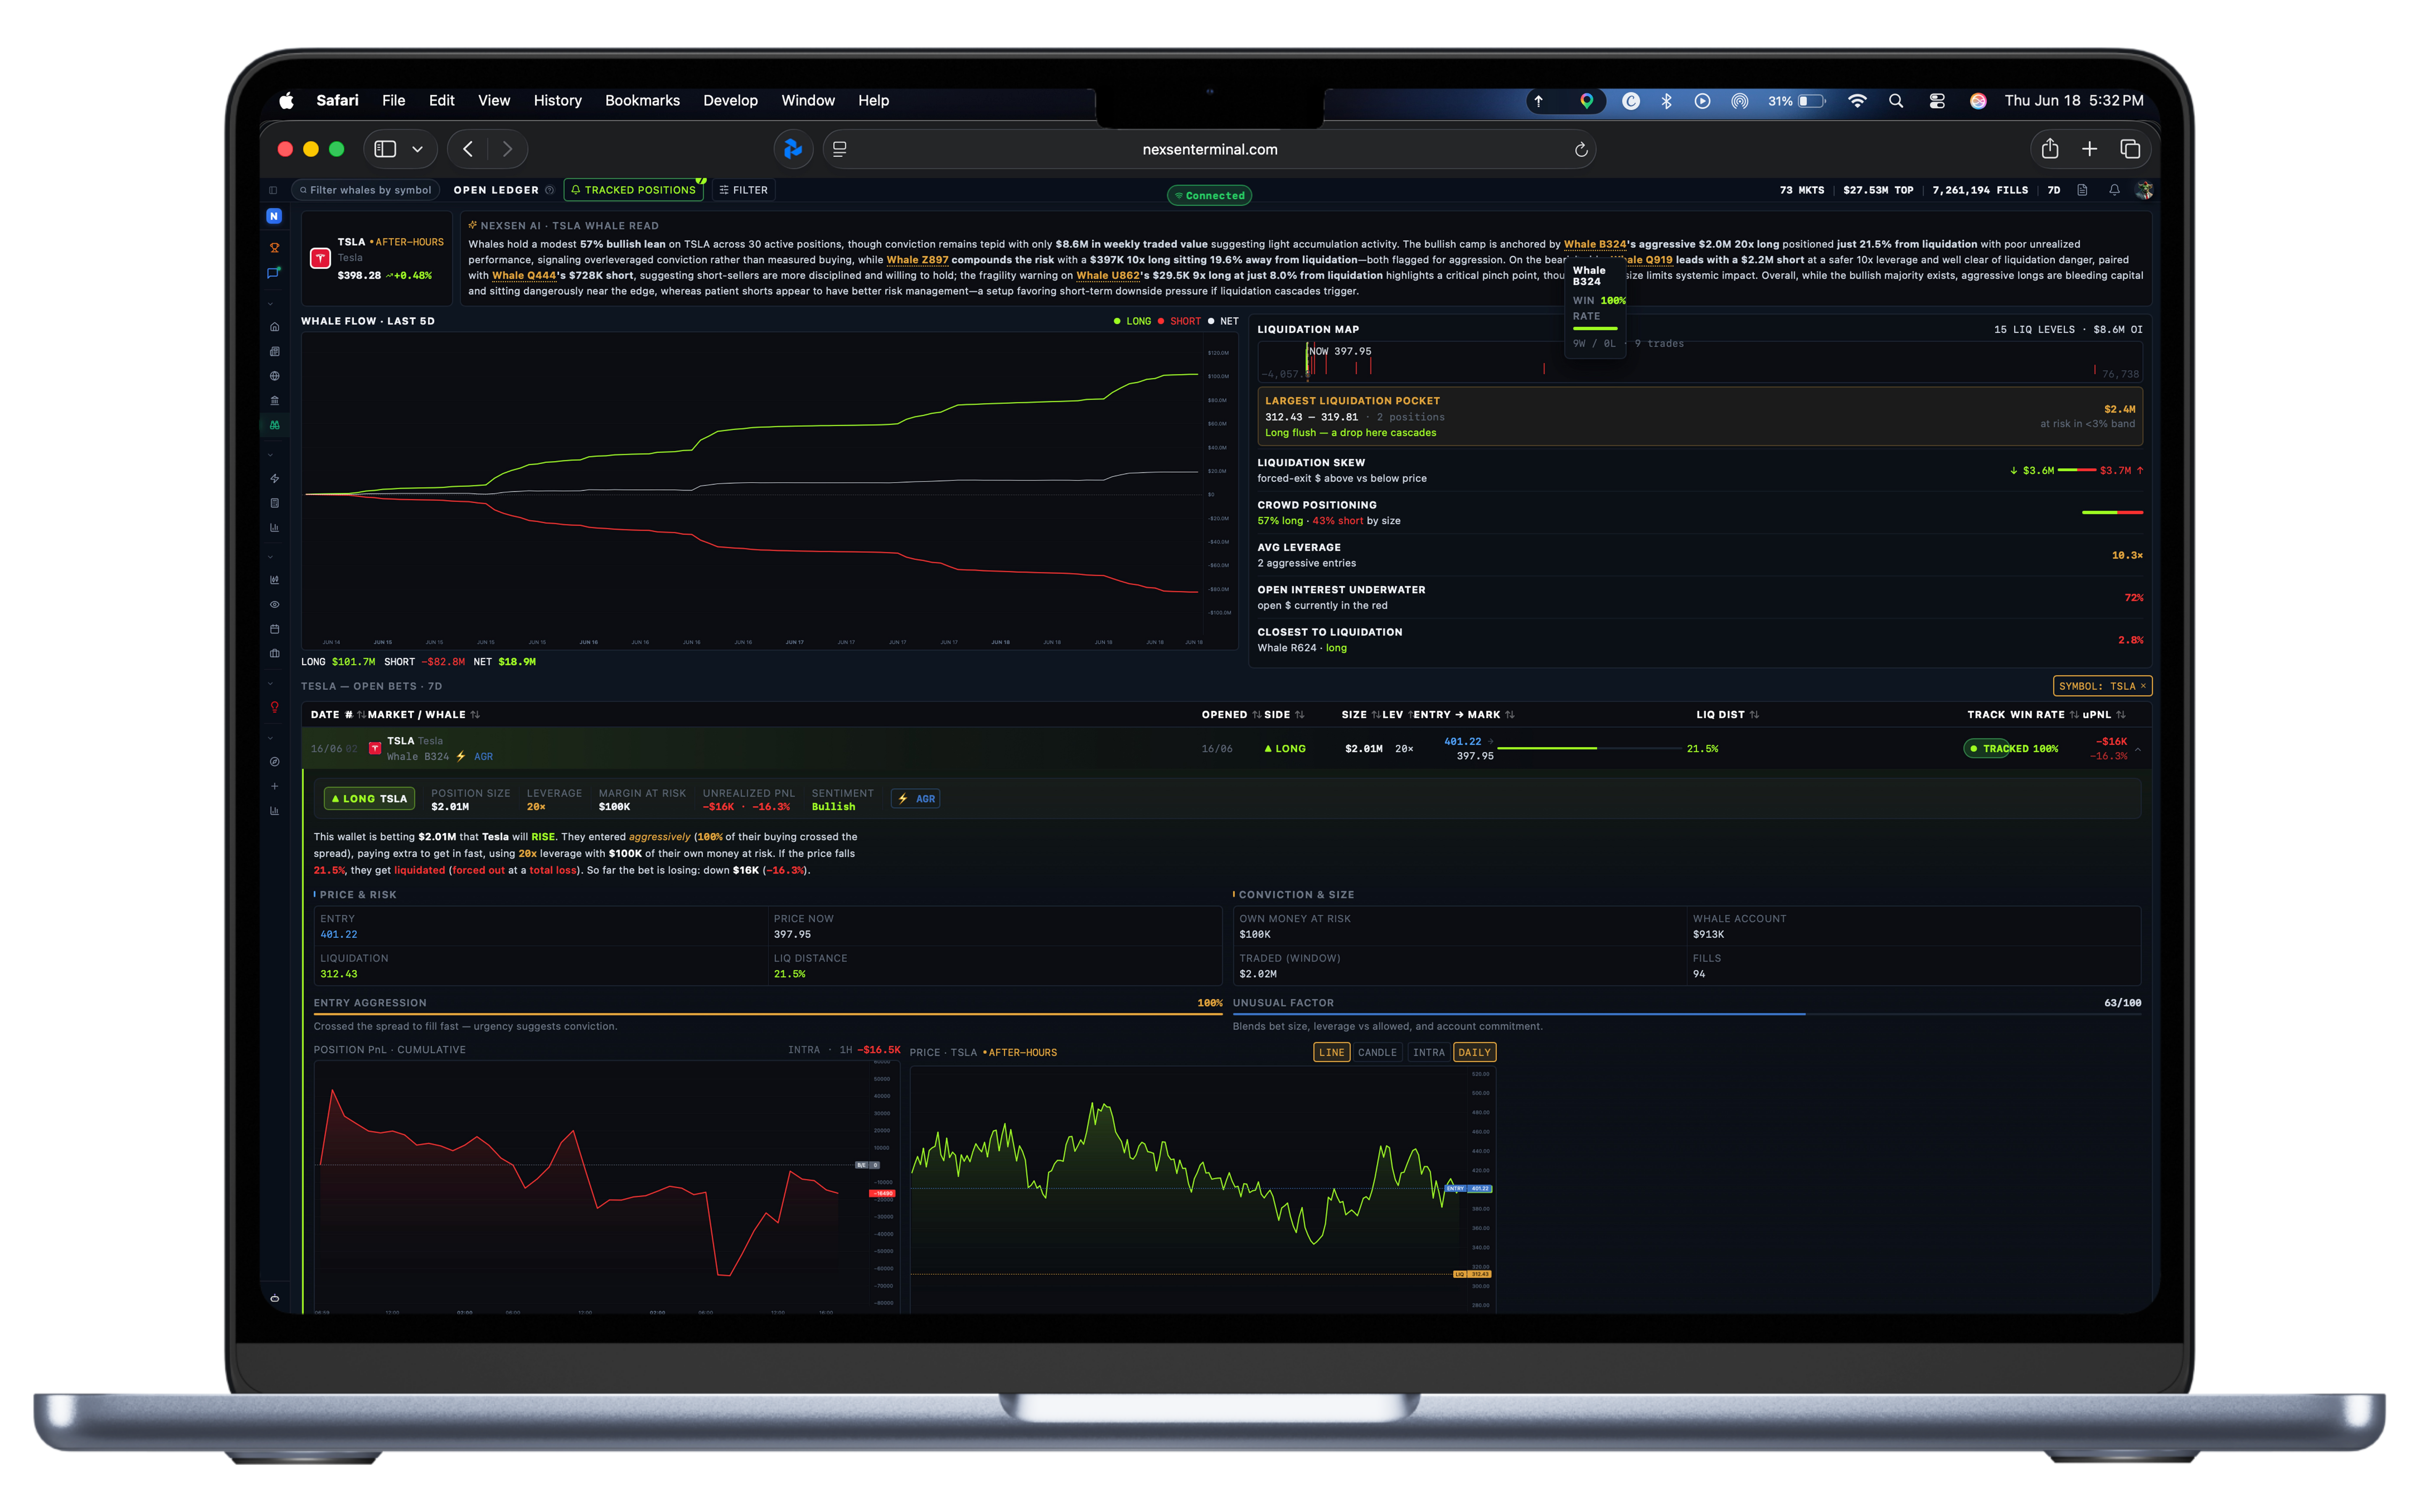
Follow the positions behind the conviction.
Explore publicly visible leveraged positions, inspect their size and direction, and follow the activity behind the names that interest you.
 Back to platform index
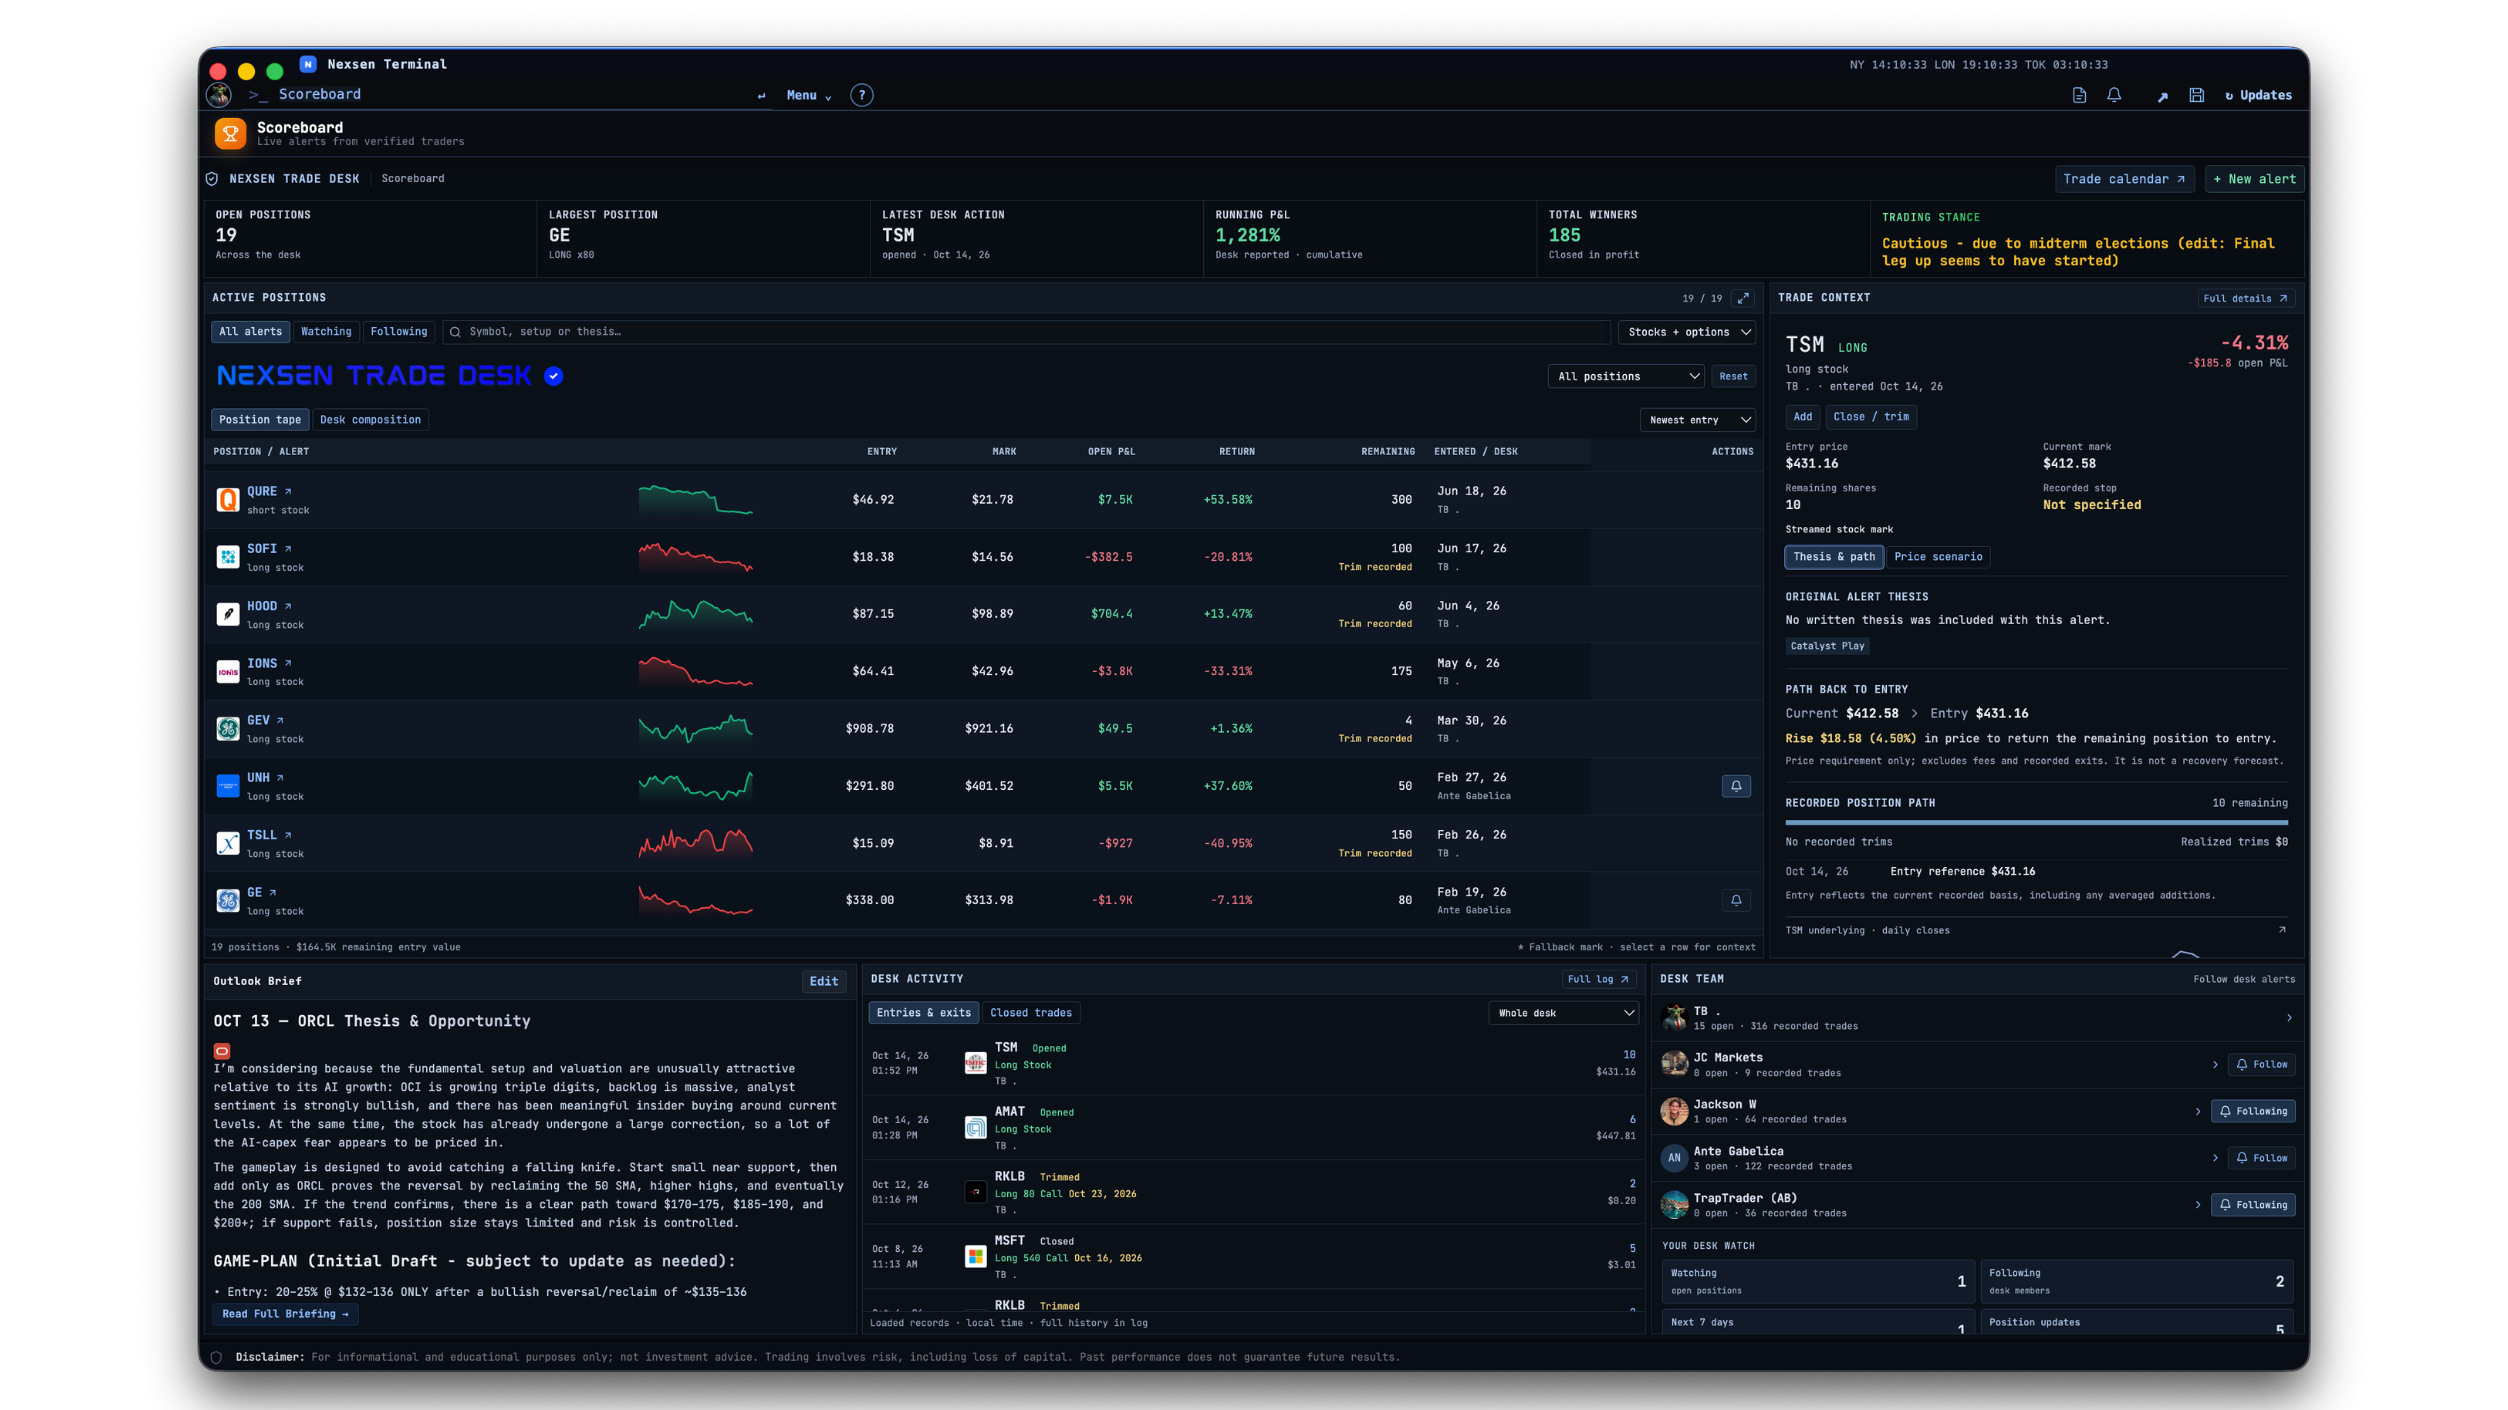
Keep the thesis beside the position.
Follow desk activity, inspect trade context and review the thinking around active ideas in a shared research workspace.
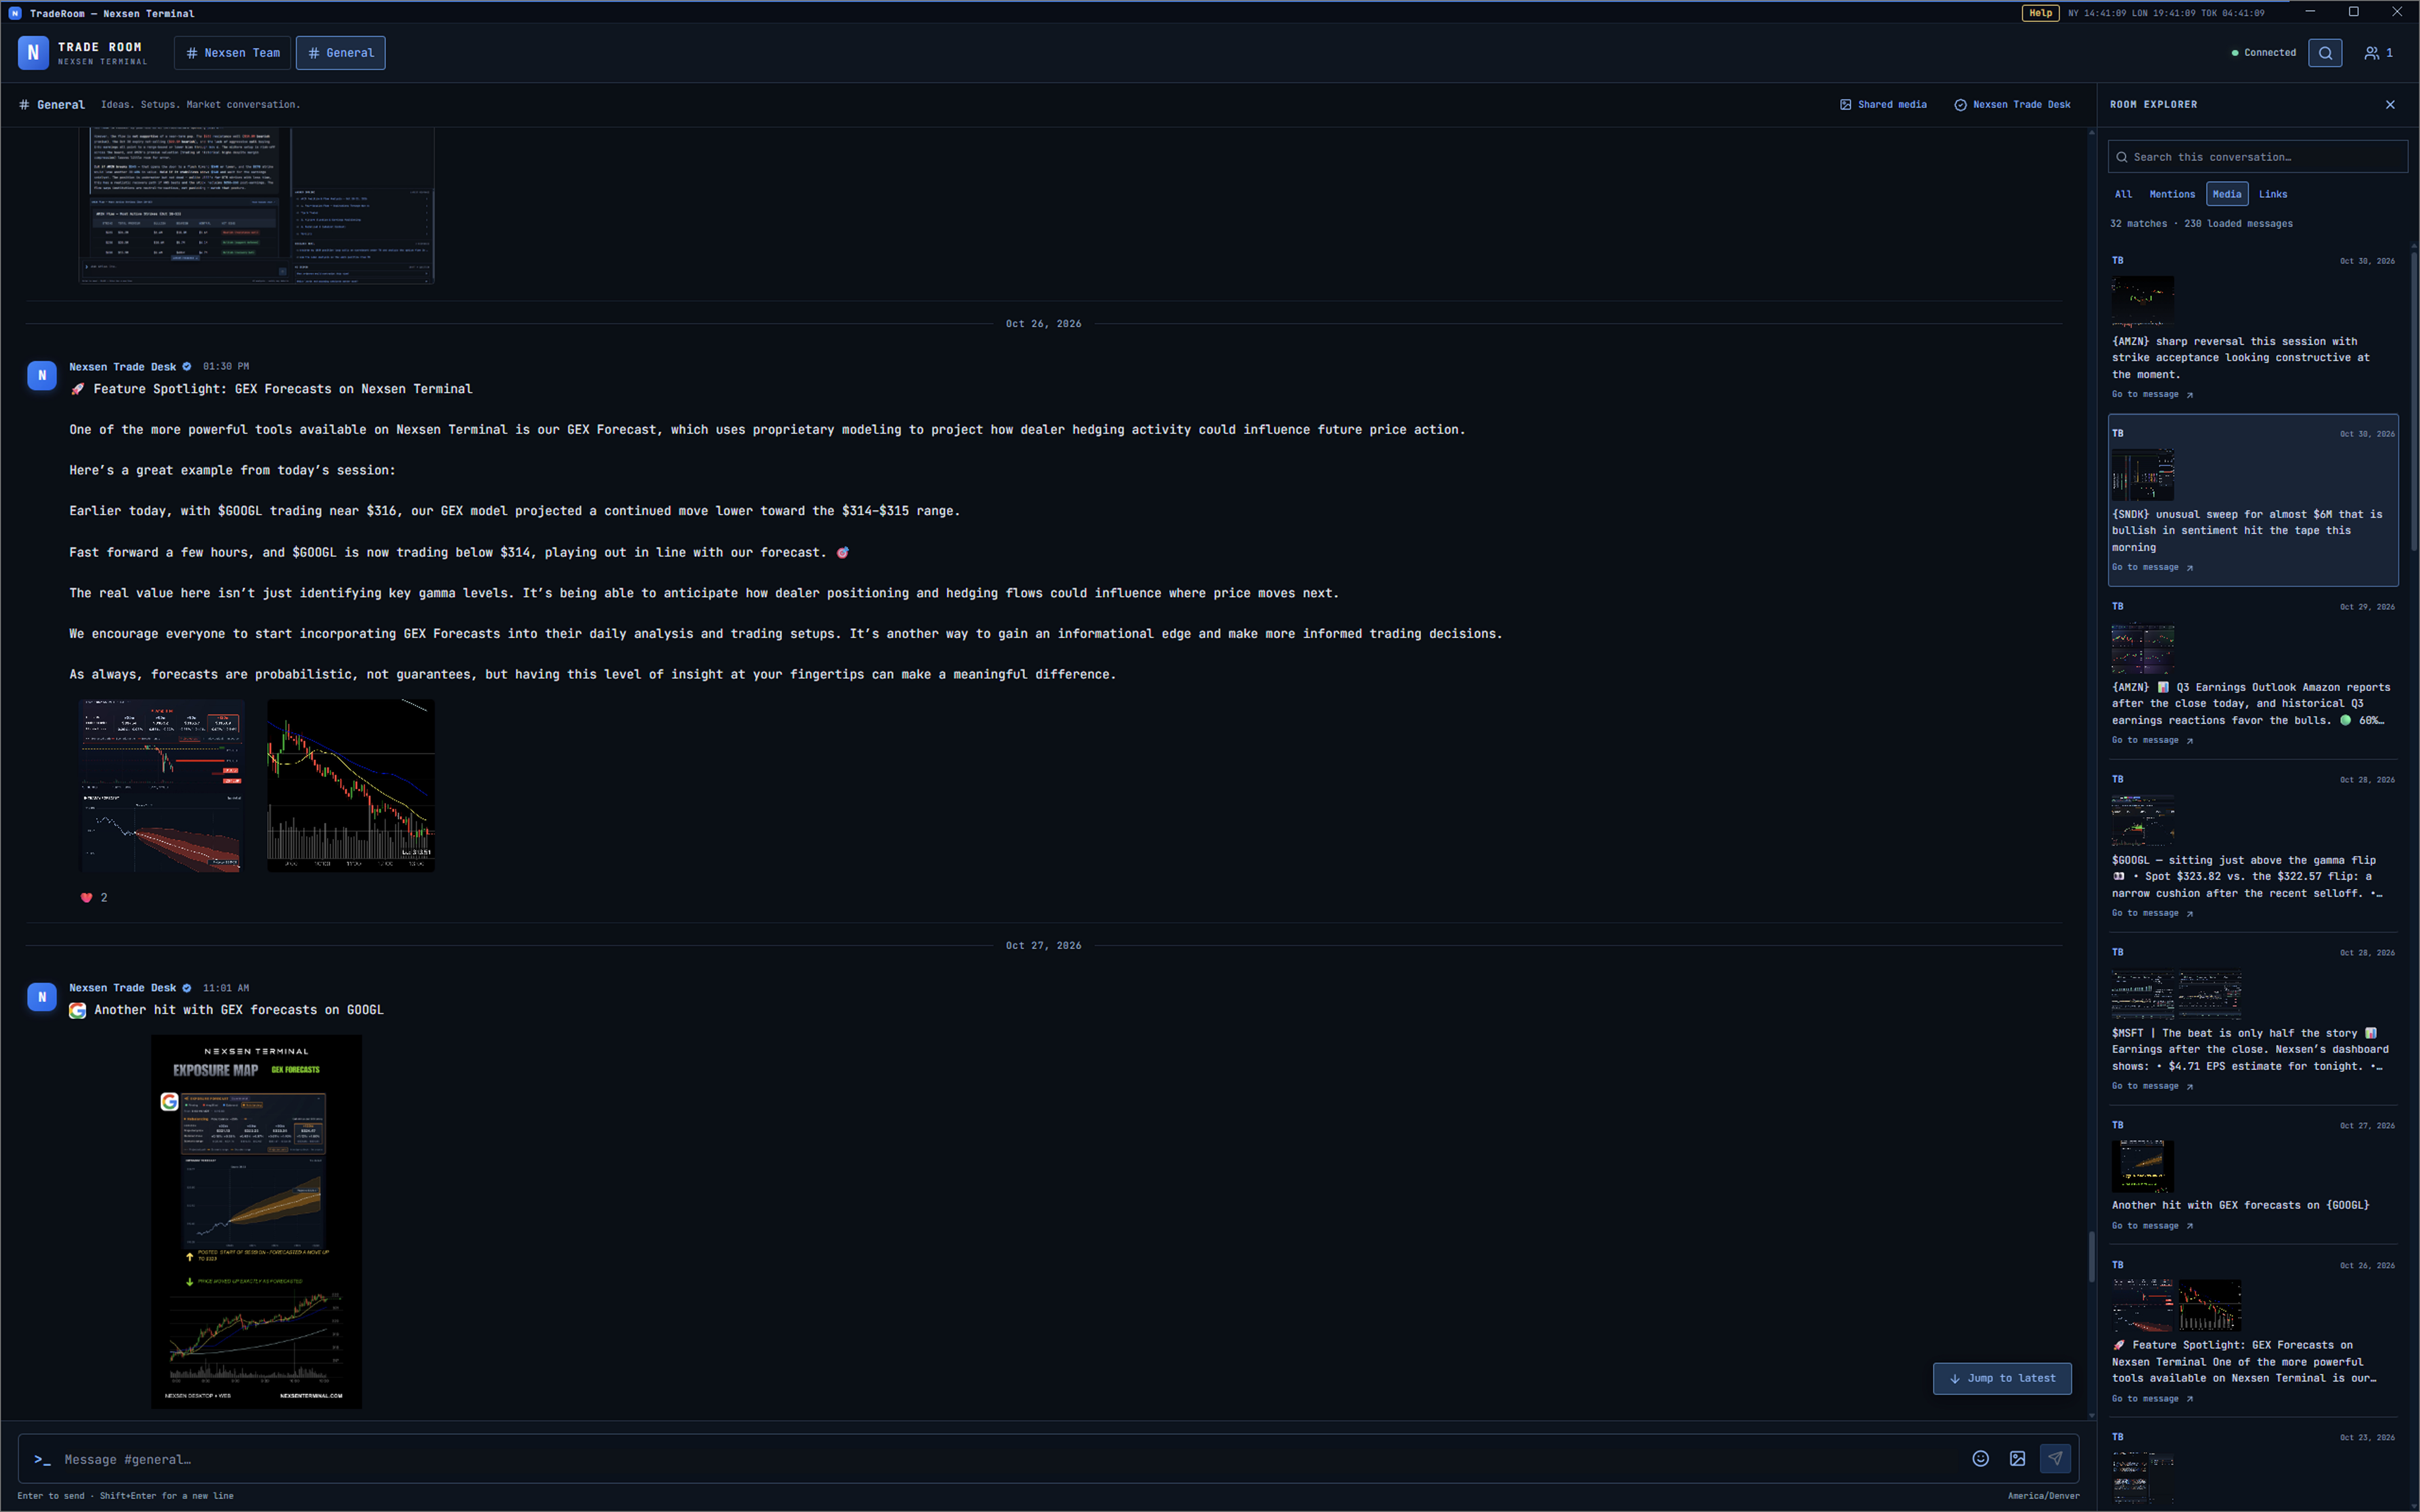
Continue the conversation.
Discuss market ideas, share charts and keep research conversations connected to the trading day.
 Back to platform index
Depth without
the disconnected tabs.
Research, analysis and collaboration share a home. Explore the tools behind the workspace.
01Options flow & Flow-Lens
Review the trade tape, Flow Pulse, heatmaps, Smart-Lens and transaction statistics to investigate activity throughout the session.
02GEX, DEX & charm
Examine exposure across strikes and expirations, compare key levels with spot, and explore modeled exposure forecasts.
03Charts & Nexsen studies
Combine technical studies, drawing tools and custom Nexsen analytics in a chart workspace with multiple timeframes.
04Deep-Lens & scenario research
Explore modeled price paths, change the forecast horizon and compare alternative outcomes under different assumptions.
05Earnings Intelligence
Connect calendars, financial statements, results matrices, reaction history and transcript research around each report.
06Atlas One & sentiment
Use conversational research and sentiment context to investigate the evidence behind an idea.
07News & Globe Intel
Follow market headlines and global catalysts alongside your market research.
08Strategy Builder
Construct options strategies and inspect modeled payoff, risk drivers and scenario adjustments.
09Scoreboard, Trade Desk & community
Explore trading ideas, follow community activity and continue the discussion in the platform.
10Watchlists & custom layouts
Organize the names you follow and arrange your working views around your own research process.
11Portfolio & disclosed activity · Coming soon
Portfolio tools and disclosed trading activity are planned additions and are not currently available.
A workspace that follows your thinking.
Explore Nexsen Terminal and see how the tools fit your daily research process.
Explore in Nexsen Terminal