Portfolio Intelligence Suite
Master Your Portfolio Like a Pro
The Portfolio Intelligence Suite transforms how you manage and analyze your holdings. From real-time P&L tracking and risk assessment to AI-powered position analysis— get deep and rich insights designed for serious traders.
Access Portfolio Suite in NexsenComplete Portfolio Command Center
Nine powerful tools to track, analyze, and optimize your portfolio performance.
Portfolio Overview & P&L Tracking
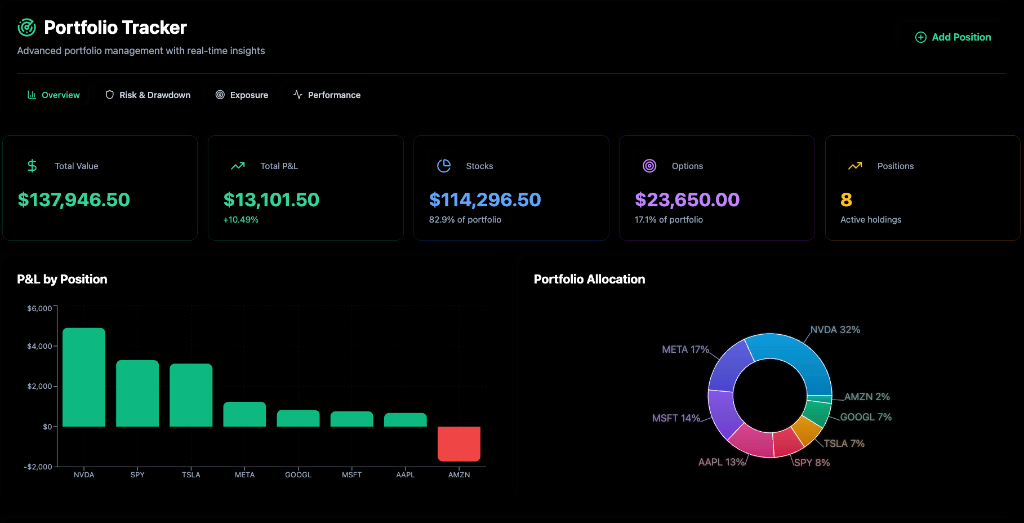
Get a complete snapshot of your portfolio at a glance. Track total value, overall P&L with percentage gains, and see your holdings broken down by stocks and options. Visualize P&L by position with intuitive bar charts and understand your allocation with a detailed pie chart. Know exactly where your money is and how it's performing—updated in real-time.
Holdings Management
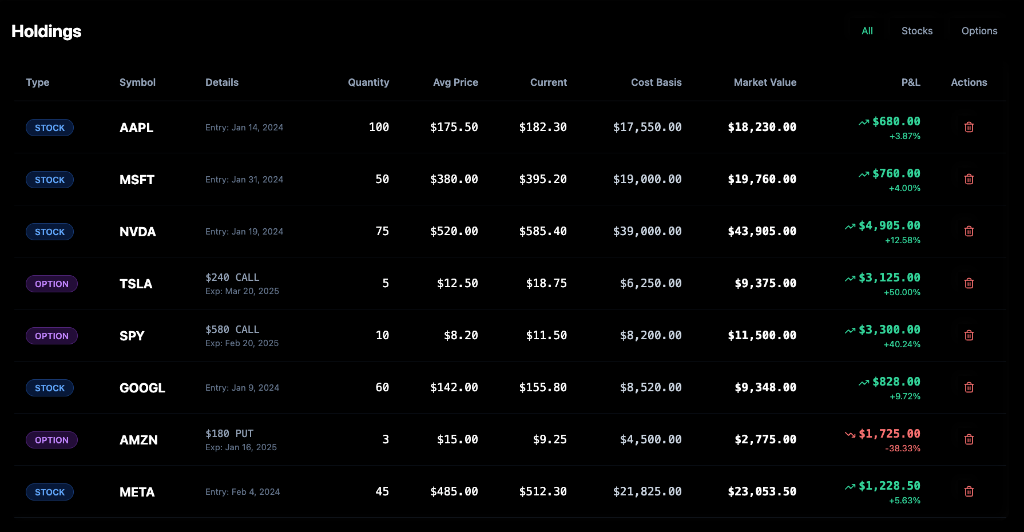
Manage every position with precision. View all your holdings in a comprehensive table showing type, symbol, quantity, average price, current price, cost basis, market value, and real-time P&L. Filter between stocks and options, track entry dates, and monitor expiration dates for options. Every detail you need to manage your positions effectively, organized in one place.
Risk Assessment & AI Portfolio Insights
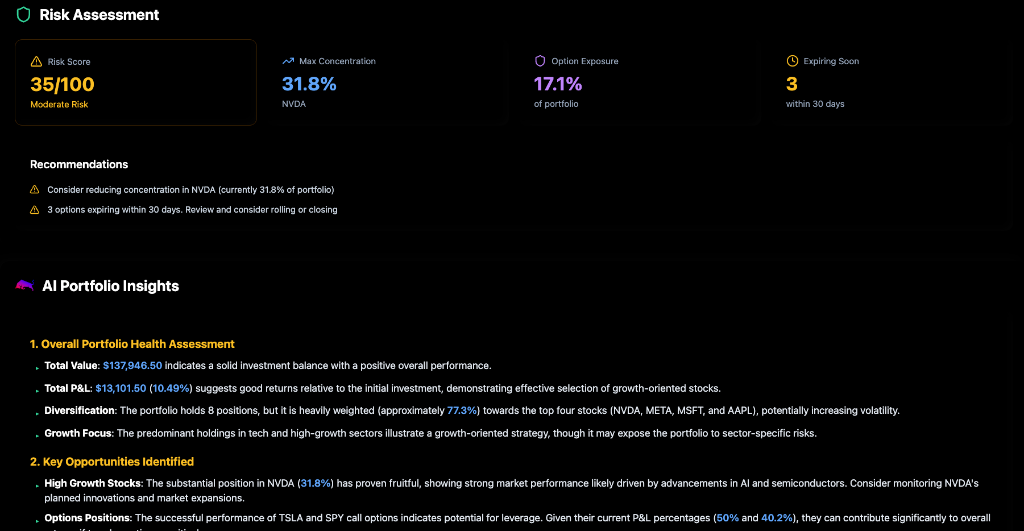
Understand your portfolio's risk profile with a comprehensive risk score, concentration analysis, and options exposure metrics. Get AI-powered recommendations on position sizing, diversification, and expiring options. Our AI analyzes your overall portfolio health, identifies key opportunities in high-growth stocks and successful options plays, and provides actionable insights tailored to your specific holdings.
Drawdown & Risk Metrics
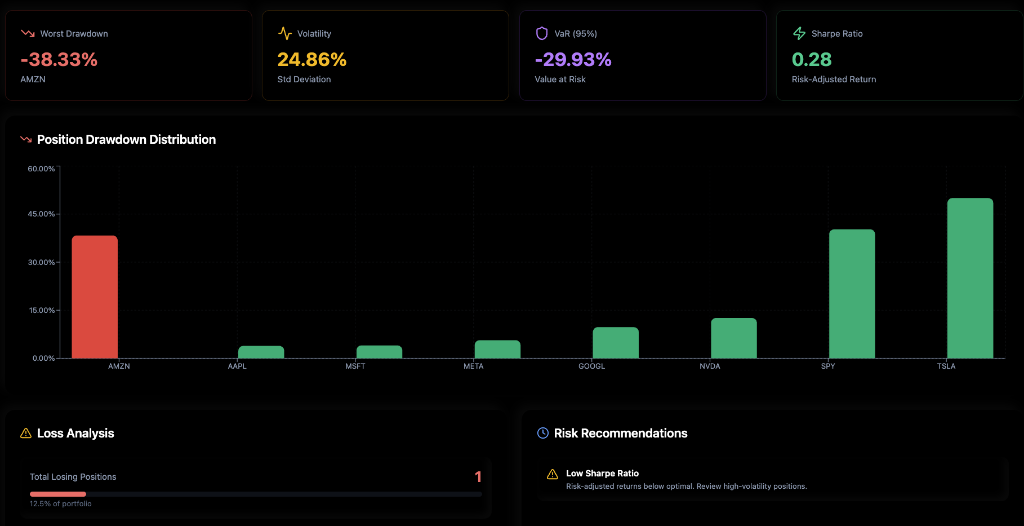
Monitor the health of your portfolio with advanced risk metrics. Track worst drawdown, portfolio volatility (standard deviation), Value at Risk (VaR), and Sharpe Ratio for risk-adjusted returns. Visualize position drawdown distribution to see which holdings are contributing most to portfolio risk. Get loss analysis and actionable risk recommendations to optimize your portfolio's risk profile.
Exposure & Concentration Analysis
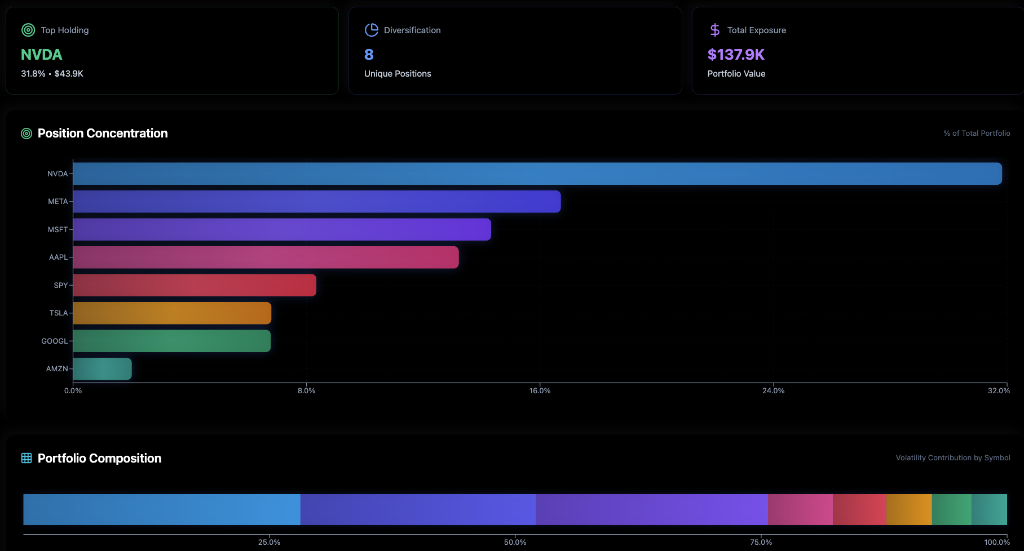
Visualize exactly how your capital is distributed. See your top holdings, diversification score, and total exposure at a glance. The position concentration chart reveals how much weight each holding carries, while the portfolio composition bar shows volatility contribution by symbol. Identify over-concentration risks and rebalancing opportunities before they become problems.
Performance Timeline & Attribution
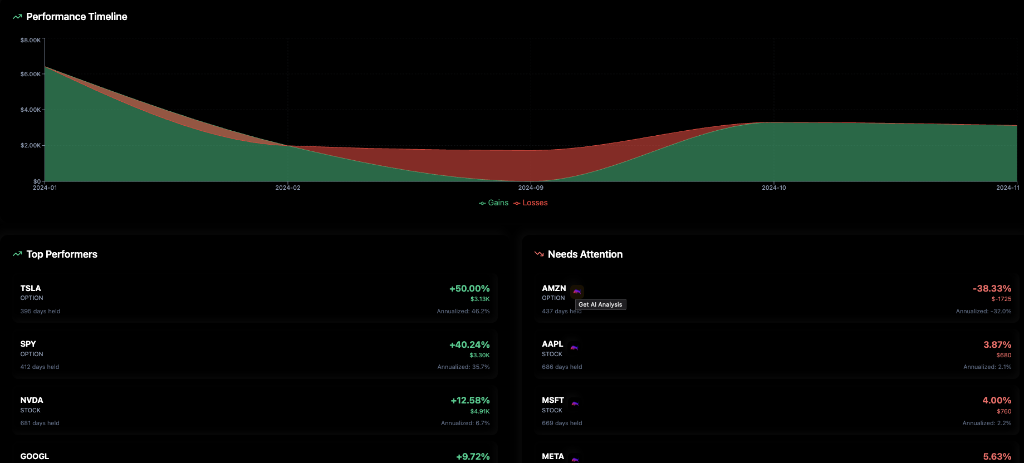
Track your portfolio's journey over time with a visual performance timeline showing gains and losses. Instantly identify your top performers with percentage gains and dollar amounts, while the 'Needs Attention' section highlights underperforming positions requiring review. Access AI analysis for struggling positions with one click. See annualized returns and days held for complete performance context.
Multi-Metric & Global Exposure Analysis
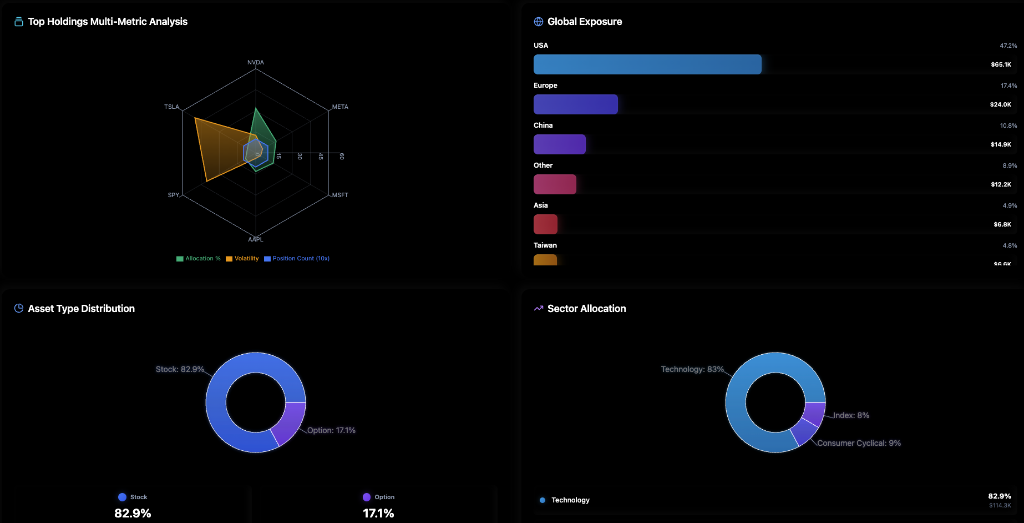
Analyze your holdings from every angle with radar charts comparing allocation, volatility, and position count across your top holdings. Understand your global exposure by region—USA, Europe, China, Asia, and more—with dollar amounts and percentages. View asset type distribution between stocks and options, plus sector allocation to ensure proper diversification across industries.
AI Position Analysis & Strategy
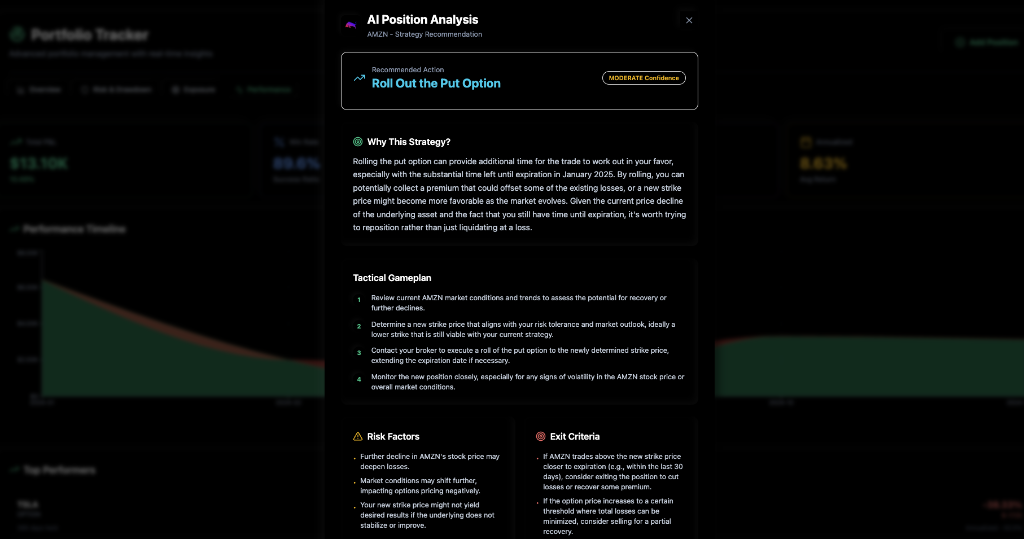
Get intelligent, actionable guidance for every position. Our AI analyzes struggling positions and provides recommended actions—whether to hold, roll, cut, or add. Understand why each strategy makes sense with detailed explanations, tactical gameplans with step-by-step instructions, risk factors to consider, and clear exit criteria. Turn losing positions into learning opportunities with data-driven strategy.
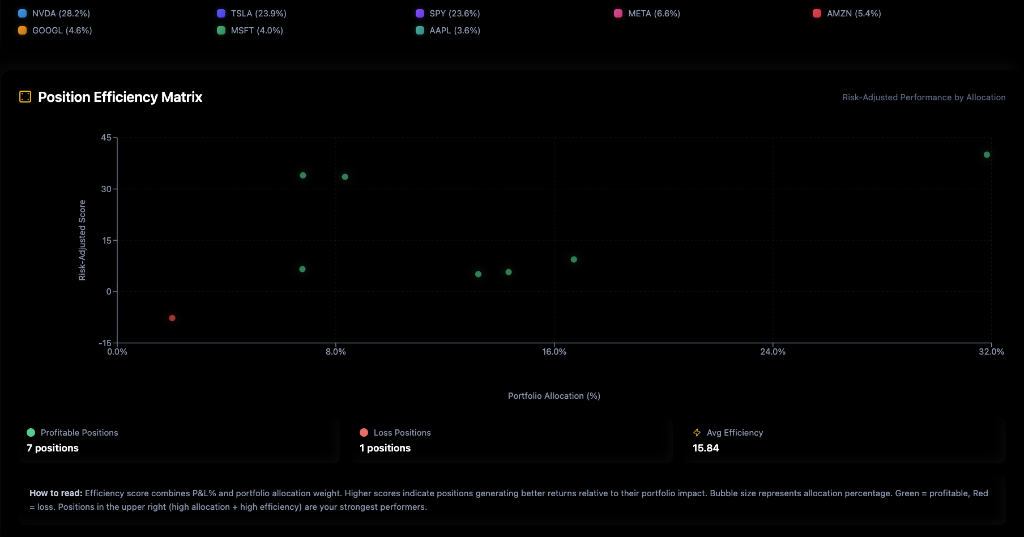
Position Efficiency Matrix
Identify your strongest and weakest positions with our efficiency matrix. Plot each position by portfolio allocation versus risk-adjusted score to see which holdings are generating the best returns relative to their portfolio impact. Bubble size represents allocation percentage, while color indicates profitability. Find your most efficient performers and spot positions that may be dragging down overall returns.
Ready to Take Control of
Your Portfolio?
Stop managing your portfolio in spreadsheets. Get real-time insights, AI-powered analysis, and institutional-grade tools in one platform.
Start Using Portfolio Suite